The AUD/USD held fairly steady on Tuesday despite a solid U.S. consumer prices report. The report showed that consumer inflation rose 0.2 percent in
The AUD/USD held fairly steady on Tuesday despite a solid U.S. consumer prices report. The report showed that consumer inflation rose 0.2 percent in October, rebounding from declines the previous two months. Its steady performance probably means the economy is strong enough to handle a December Fed rate hike.
The Forex pair has held up pretty well this month in the wake of further weakness in commodities and a strong chance that the U.S. Federal Reserve will raise rates next month. The unexpected resilience is likely coming from the notion that the Reserve Bank of Australia will leave the cash rate at 2 percent despite several potentially negative factors such as the economic slowdown in China, sluggish household wage and spending growth at home.
Current data shows that traders are predicting a 68 percent chance of more cuts by July, almost two full cuts had been priced in. The recovery in global equity markets is also helping to underpin the Australian Dollar as investors seek greater exposure to higher-yielding assets.
Earlier today, the Conference Board’s Leading Index for Australia showed a 0.1% decline. The MI Leading Index posted a 0.1% gain and the Wage Price Index was up 0.6% as expected. Later today, traders will get the opportunity to react to U.S. building permits and housing starts. The FOMC Meeting Minutes will be most important. They are expected to highlight the divergences between the U.S. Federal Reserve and the Reserve Bank of Australia monetary policies.
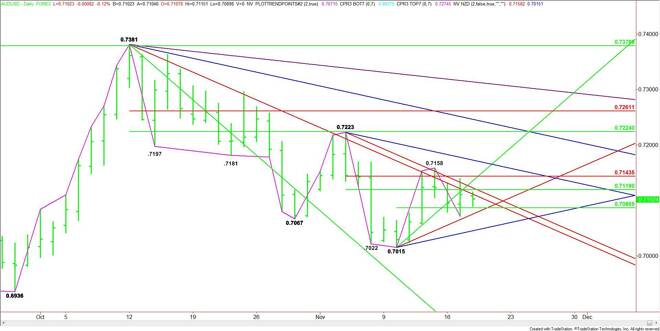
Technically, the main trend is down according to the daily swing chart.
The short-term range is .7015 to .7158. Its 50% level at .7086 is currently provided support.
The intermediate range is .7223 to .7015. Its retracement zone at .7119 to .7143 is currently providing resistance.
Based on Tuesday’s close at .7110, the key level to watch on the upside is the 50% level at .7119 and the key level on the downside is .7086. A downtrending angle at .7111 is also guiding the market lower.
A sustained move over .7119 will indicate the presence of buyers. This could lead to a quick test of the short-term downtrending angle at .7123. The daily chart opens to the upside over this level with the Fibonacci level at .7143 the next target.
The Fib level at .7143 is also a trigger point for an upside breakout with the next target the main top at .7158, followed by a downtrending angle at .7173. The main trend will turn up on the daily chart on a move through .7158.
A sustained move through .7086 will indicate the presence of sellers with the first target an uptrending angle at .7075. The daily chart opens up to the downside under this level with the next target coming in at .7045.
Look for an upside bias to develop on a sustained move over .7119 and a downside bias on a sustained move under .7086.
James Hyerczyk is a U.S. based seasoned technical analyst and educator with over 40 years of experience in market analysis and trading, specializing in chart patterns and price movement. He is the author of two books on technical analysis and has a background in both futures and stock markets.