
Advertisement
Advertisement
AUD/USD Forex Technical Analysis – November 19, 2015 Forecast
By:
The AUD/USD is trading sharply higher in reaction to the FOMC minutes, which traders perceived as less-hawkish as the previously released Fed monetary
The AUD/USD is trading sharply higher in reaction to the FOMC minutes, which traders perceived as less-hawkish as the previously released Fed monetary policy statement. The strength of the buying may have caught short-sellers off-guard in light of the recent current steep drop in commodity prices and the strong probability of a December interest rate hike by the Fed. These two factors, however, may ultimately limit gains.
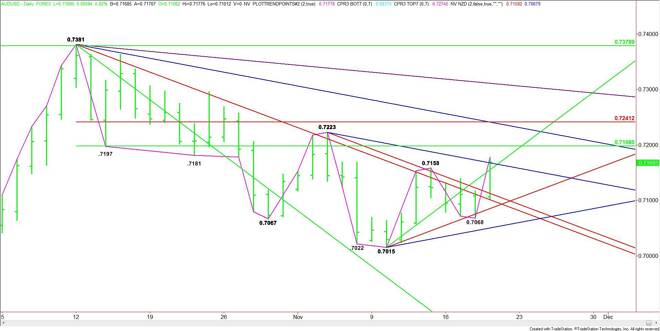
Technically, the AUD/USD surged after finding support at a short-term retracement zone and taking out a pair of downtrending angles that had been suppressing prices since mid-October.
The main trend turned up on the daily chart earlier in the session when the Aussie took out the last swing top at .7158. The new swing bottom is now .7068.
The main range is .7381 to .7015. Its retracement zone at .7198 to .7241 is the primary upside target.
Based on the current price at .7171, the direction of the market the rest of the session is likely to be determined by trader reaction to an angle at .7168.
A sustained move over .7168 will indicate the presence of buyers. The first upside objective is the 50% level at .7198. Taking out this level with conviction could lead to a further rally into the resistance cluster at .7241. This price is a combination of a long-term downtrending angle and Fibonacci level, making it the best target for the day.
A sustained move under .7168 will signal the presence of sellers. The first downside target is a short-term uptrending angle at .7155. Crossing to the weak side of this angle will put the AUD/USD in a position to accelerate to the downside.
If sellers come in hard on a move under .7155 then look for a possible break into a series of potential support angles at .7113, .7101 and .7085.
Watch the price action and read the order flow at .7168. Trader reaction to this level will tell us if the buyers are still coming in to support the rally, or if short-sellers are starting to regain control.
About the Author
James Hyerczykauthor
James Hyerczyk is a U.S. based seasoned technical analyst and educator with over 40 years of experience in market analysis and trading, specializing in chart patterns and price movement. He is the author of two books on technical analysis and has a background in both futures and stock markets.


Advertisement