
Advertisement
Advertisement
AUD/USD Forex Technical Analysis – November 20, 2015 Forecast
By:
The AUD/USD spiked to a two-week high on Thursday as traders continued to react to the FOMC minutes released on Wednesday. The minutes reiterated the
The AUD/USD spiked to a two-week high on Thursday as traders continued to react to the FOMC minutes released on Wednesday. The minutes reiterated the expectation that interest rates would rise at its December meeting, however, U.S. Dollar investors expressed concerns about the timing of future rate hikes.
The Fed is likely to pull the trigger on an interest rate hike at its December 16-17 meeting, however, after the initial rate hike, the next rate hikes are likely to be more gradual than traders had been anticipating. The price action in the AUD/USD suggests that investors are readjusting their positions to reflect the staggered future interest rate hikes.
Once the readjustments are complete, the AUD/USD is likely to sell-off once again as traders react to the plunge in commodity prices that are showing no signs of bottoming. Although the Reserve Bank seems content with the economy and has no plans to raise interest rates in December, conditions could shift rather quickly if the country’s revenues weaken enough because of the lower commodity prices. Any renewed talk of an RBA rate hike in December will be bearish for the AUD/USD.
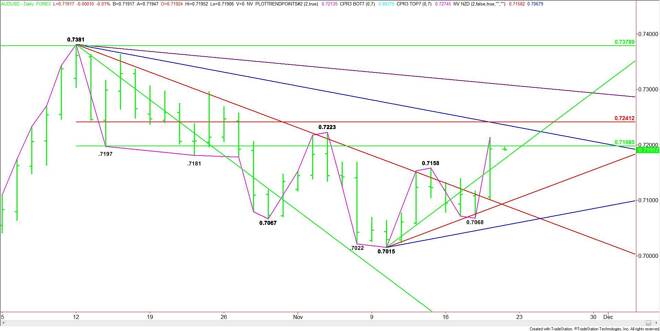
Technically, the main trend is up according to the daily swing chart. It turned up on Thursday when the market crossed the November 13 top at .7158. The new swing bottom is .7068.
The main range is .7381 to .7015. Its retracement zone is .7198 to .7241. The AUD/USD is currently straddling the lower, or 50% level at .7198. It is also trading a little below the November 4 swing top at .7223. This top was put in two days before the stronger-than-expected U.S. Non-Farm Payrolls report that eventually drive the Forex pair to .7015. In other words, the current rally has been strong enough to erase all of its losses triggered by the U.S. jobs report.
Based on Thursday’s close at .7193, the direction of the market today is likely to be determined by trader reaction to the 50% level at .7198.
A sustained move over .7198 will signal the presence of buyers. This may create enough upside momentum to test the main top at .7223, a long-term downtrending angle at .7236 and the Fibonacci level at .7241.
The Fib level is a trigger point for an acceleration to the upside with .7309 the next likely target. This is the last angle before the .7381 main top.
A sustained move under .7198 will indicate the presence of sellers. The first downside target is an uptrending angle at .7175. This level is also the trigger point for a steep sell-off since the next support angle doesn’t come in until .7095.
Watch the price action and read the order flow at .7198 today. Trader reaction to this level will tell us whether the bulls are willing to keep buying, or if short-sellers are regaining control.
About the Author
James Hyerczykauthor
James Hyerczyk is a U.S. based seasoned technical analyst and educator with over 40 years of experience in market analysis and trading, specializing in chart patterns and price movement. He is the author of two books on technical analysis and has a background in both futures and stock markets.


Advertisement