
Advertisement
Advertisement
AUD/USD Forex Technical Analysis – November 24, 2015 Forecast
By:
The AUD/USD finished lower on Monday as a stronger U.S. Dollar continued to pressure commodity prices. The selling disrupted the trend that had driven the
The AUD/USD finished lower on Monday as a stronger U.S. Dollar continued to pressure commodity prices. The selling disrupted the trend that had driven the Forex pair to a 2 week high. Short-sellers hit the market hard on increased bets the U.S. Federal Reserve would raise rates in December. Additionally, further declines in the price of commodities such as gold, copper and zinc also weighed on the Aussie.
Hawkish Fed member commentary is also helping to underpin the Greenback. Over the week-end, San Francisco Fed President John Williams said that the case for a December “lift-off” in interest rates was firming.
“Assuming we continue to get good data on the economy, continue to get signs that we are moving closer to achieving our goals and gaining confidence getting back to 2 percent inflation, if that continues to happen, there’s a strong case to be made in December to raise rates,” he said during a panel discussion at the University of California in Berkeley.
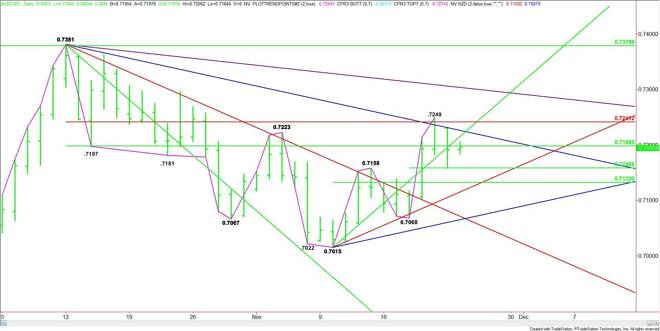
Technically, the main trend is up according to the daily swing chart, but momentum appears to be shifting to the downside after the AUD/USD ran into resistance inside a major retracement zone. Trader reaction to this zone should set the tone of the market over the near-term.
The main range is .7381 to .7015. Its retracement zone is .7198 to .7241. This zone was tested last Friday when the market posted a minor top at .7249. Yesterday, the market straddled the lower, or 50% level at .7198 throughout the session.
Based on the close at .7191, the direction of the market is likely to be determined by trader reaction to the 50% level at .7198.
A sustained move over .7198 could trigger a rally into pair of angles at .7215 and .7226. This is followed closely by the Fib level at .7241 and the minor top at .7249.
Look for a labored rally until .7249 is cleared. This level is a trigger point for an acceleration to the upside with the next target a downtrending angle at .7304.
A sustained move under .7198 will signal the presence of sellers. The daily chart is open to the downside with the first target a minor 50% level at .7158. This is also the trigger point for further downside action with the next target another 50% level at .7132. The main support angle comes in at .7115.
Watch the price action and read the order flow at .7198 today. Trader reaction to this level will tell us if the bulls or the bears are in control. Volume is expected to be below average because of a U.S. bank holiday on Thursday. Look for increased volatility at 8:30 a.m. ET with the release of the U.S. Preliminary GDP report.
About the Author
James Hyerczykauthor
James Hyerczyk is a U.S. based seasoned technical analyst and educator with over 40 years of experience in market analysis and trading, specializing in chart patterns and price movement. He is the author of two books on technical analysis and has a background in both futures and stock markets.


Advertisement