
Advertisement
Advertisement
AUD/USD Forex Technical Analysis – November 25, 2015 Forecast
By:
The AUD/USD rallied on Tuesday in response to comments from Reserve Bank Governor Glenn Stevens. The Aussie moved towards a one-month high, shrugging off
The AUD/USD rallied on Tuesday in response to comments from Reserve Bank Governor Glenn Stevens. The Aussie moved towards a one-month high, shrugging off a new low in iron ore prices.
At a gathering of business economists on Tuesday evening, Stevens said that he “happened to agree with” the argument for holding the cash rate target steady at 2 percent when the board next meets on December 1.
“I’m more than content to lower it if that actually helps, but is that the best thing to do at any particular time?” Stevens said in response to a question on the cash rate. “We’ve got Christmas. We should just chill out, come back and see what the data says.”
The AUD/USD proved resilient to a further fall in the benchmark price of iron ore as well as the shooting down of a Russian fighter jet by Turkey, which spooked the financial markets and lifted the price of oil.
Some traders doubt the Aussie will be able to sustain its climb in the face of an expected interest rate hike by the Fed on December 17. The overall market is still pricing in two RBA rate cuts in 2016.
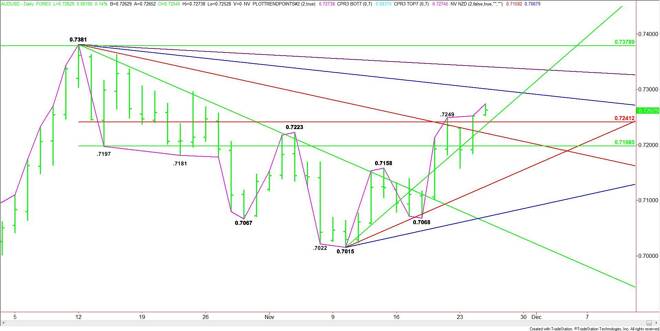
Technically, the main trend is up according to the daily swing chart. The AUD/USD is also trading on the strong side of a retracement zone. Both moves indicate the presence of strong buying.
Based on Tuesday’s close at .7252, the direction of the market today is likely to be determined by trader reaction to the Fibonacci level at .7241.
A sustained move over .7241 will signal the presence of buyers. The daily chart indicates there is room to the upside with the first target a downtrending angle at .7301. The next target is another downtrending angle at .7341. This is the last major angle before the .7381 main top.
A sustained move under .7241 will indicate the presence of sellers. This should trigger a quick move into an uptrending angle at .7235. The weakness could extend under this angle with the next target a long-term downtrending angle at .7221. This is followed by the major 50% level at .7198.
The 50% level at .7198 is also a trigger point for an acceleration to the downside with the next major target coming in at .7125.
Watch the price action and read the order flow at .7241 today. Trader reaction to this level will tell us whether the bulls or the bears are in control.
About the Author
James Hyerczykauthor
James Hyerczyk is a U.S. based seasoned technical analyst and educator with over 40 years of experience in market analysis and trading, specializing in chart patterns and price movement. He is the author of two books on technical analysis and has a background in both futures and stock markets.


Advertisement