
Advertisement
Advertisement
AUD/USD Forex Technical Analysis – November 3, 2015 Forecast
By:
The AUD/USD strengthened shortly before the European Forex opening. The catalysts behind the move was the Reserve Bank of Australia’s decision to keep its
The AUD/USD strengthened shortly before the European Forex opening. The catalysts behind the move was the Reserve Bank of Australia’s decision to keep its policy rate unchanged at 2% despite falling inflation rates.
The RBA reiterated that its monetary policy needs to be accommodating. The central bank also said that “the Australian dollar is adjusting to the significant declines in key commodity prices” and “business surveys suggest a gradual improvement in conditions over the past year.”
The RBA started its easing cycle because it thought the Aussie was too strong, hurting Australian exports. Today’s monetary policy statement indicates that the RBA is counting on the U.S. Federal Reserve to keep the pressure on the Australian Dollar.
This was confirmed when the RBA stated, “The Federal Reserve is expected to start increasing its policy rate over the period ahead”.
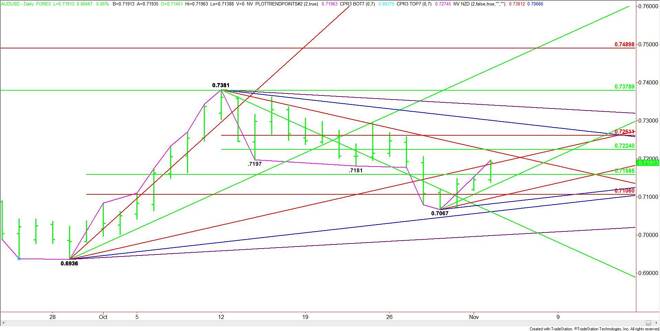
Technically, the main trend is up according to the daily swing chart. After a prolonged move down since October 12, it looks like momentum may have started shifting to the upside since October 29.
The main range is .6936 to .7381. Its retracement zone at .7158 to .7106 has been tested several times over the last week.
The short-term range is .7381 to .7067. Its retracement zone at .7224 to .7261 is the primary upside target. Trader reaction to this zone will determine the direction of the market over the near-term. Sellers are going to try to form a potentially bearish secondary lower top, buyers are going to try to drive the market through this zone, making .7067 a new secondary higher bottom.
Based on the current price at .7194, the key angle to watch is an uptrending angle at .7186. A sustained move over this angle could create enough upside momentum to challenge a long-term downtrending angle at .7221. This is followed by a short-term 50% level at .7224 and a short-term Fibonacci level at .7261.
A sustained move under .7186 will indicate the presence of sellers. The first downside target is the major 50% level at .7158.
The daily chart opens up to the downside under .7158 with the next target a minor uptrending angle at .7127. This is followed by the major Fibonacci level at .7106.
Watch the price action and read the order flow at .7186 the rest of the session. Trader reaction to this angle will tell us whether the bulls or the bears are in control today.
About the Author
James Hyerczykauthor
James Hyerczyk is a U.S. based seasoned technical analyst and educator with over 40 years of experience in market analysis and trading, specializing in chart patterns and price movement. He is the author of two books on technical analysis and has a background in both futures and stock markets.


Advertisement