
Advertisement
Advertisement
AUD/USD Forex Technical Analysis – November 4, 2015 Forecast
By:
The AUD/USD continued its four day rally early Wednesday, leading to a test of a key 50% level. Trader reaction to this level will like set the tone for
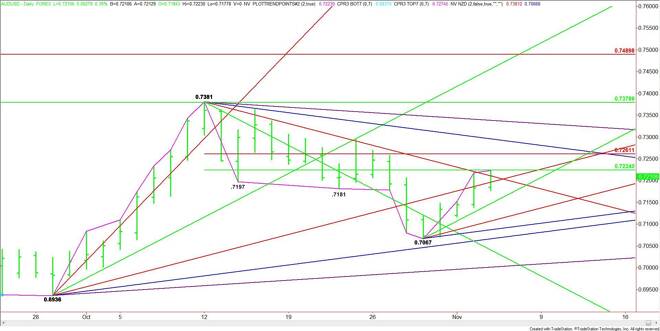
The AUD/USD continued its four day rally early Wednesday, leading to a test of a key 50% level. Trader reaction to this level will like set the tone for the rest of the session. The Australian Dollar received a boost following the Reserve Bank’s decision to keep interest rates on hold yesterday.
The RBA kept the cash rate at a record low of 2.0 percent at its monthly policy meeting, where it has been since May. It also added that the economy had actually “firmed a little” in recent months with business conditions improving and employment stronger than expected.
It also said that low inflation meant there might be room for further easing, however, there was nothing suggesting an urgency for a December rate cut. The market’s price action suggests that investors do not appear to be convinced on the timing of the next move. The odds of an end of the year rate cut dropped from two-thirds to one-third.
Technically, the main trend is up according to the daily swing chart. After a prolonged move down from October 12, the current rally from October 29 suggests the momentum is once again moving to the upside.
The main range is .7381 to .7067. Its retracement zone is .7224 to .7261. This is the primary upside target. Trader reaction to this zone will determine the direction of the Forex pair over the near-term. Trader reaction to the 50% level, however, will determine the direction the remainder of the session.
The market is currently trading at .7216.
The first upside target is the 50% level at .7224. This 50% level was tested earlier in the session when the market rallied to .7223.
A sustained move over .7224 will indicate the presence of buyers. This could trigger a further rally into the Fibonacci level at .7261. This is followed by a downtrending angle at .7296.
A sustained move under .7224 will signal the presence of sellers. The first downside objectives are a long-term downtrending angle at .7211 and a long-term uptrending angle at .7196.
The daily chart opens up to the downside under .7196 with potential targets short-term uptrending angles at .7147 and .7107.
Based on the current trade at .7216, watch the price action and order flow at .7224 the rest of the session. Trader reaction to this level will determine the direction of the market the rest of the session. It will also tell us whether the bulls or the bears are in control.
About the Author
James Hyerczykauthor
James Hyerczyk is a U.S. based seasoned technical analyst and educator with over 40 years of experience in market analysis and trading, specializing in chart patterns and price movement. He is the author of two books on technical analysis and has a background in both futures and stock markets.


Advertisement