
Advertisement
Advertisement
AUD/USD Forex Technical Analysis – November 6, 2015 Forecast
By:
The AUD/USD is trading in a tight range on low volume ahead of the release of today’s U.S. Non-Farm Payrolls report for October. Traders expect payrolls
The AUD/USD is trading in a tight range on low volume ahead of the release of today’s U.S. Non-Farm Payrolls report for October. Traders expect payrolls growth of 179,000 with the unemployment rate tipped to hold steady at 5.1%. Average hourly earnings, a crucial component of the release given its implications for future inflationary trends, is forecast to rise 0.2% leaving the annual rate unchanged at 2.2%.
Earlier today, the Reserve Bank of Australia released its quarterly statement on monetary policy. In the report, the RBA sounded more upbeat about jobs growth and the housing market, which means another interest rate cut is looking unlikely.
It also said that the unemployment rate wills stay in its recent range between 6.00 to 6.25 percent, and then gradually decline over the next few years. In its previous forecasts issued in August, it said that the unemployment rate will peak below 6.5 percent.
The central bank also slightly reduced its forecasts for inflation, which it says will give it plenty of scope to cut the cash rate if it’s needed. The central bank is also optimistic about the housing market, saying it will ease only a little from its recent record highs.
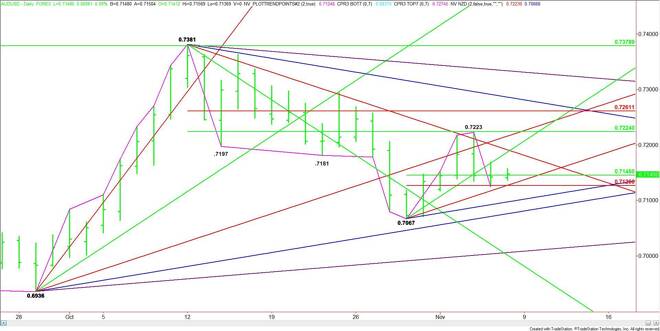
Technically, the main trend is up according to the daily swing chart. However, momentum has shifted to the downside.
The main range is .7381 to .7067. Its retracement zone is .7224 to .7261. Earlier in the week, the Aussie stopped at .7223, just shy of the major 50% level at .7224.
The new short-term range is .7067 to .7223. Its retracement zone is .7145 to .7127. This zone is currently being tested. Trader reaction to this zone is likely to determine the tone of the market today.
Based on yesterday’s close at .7142, the key number to watch is the 50% level at .7145.
A sustained move over .7145 will indicate the presence of buyers. The daily chart indicates there is room to the upside with the next target a price cluster at .7187 to .7191. Look for a technical bounce on the first test of this zone, but be prepared for a breakout to the upside if .7191 is taken out with conviction.
The potential upside targets over .7191 include a long-term uptrending angle at .7216, a major 50% level at .7224 and a major Fibonacci level at .7261.
A sustained move under .7145 will signal the presence of sellers. The first downside objective is a price cluster at .7127. Watch for a technical bounce on the first test of this area.
Taking out .7127 could trigger an acceleration to the downside with the next target a short-term uptrending angle at .7097. This is followed close by a long-term uptrending angle at .7076.
A trade through the swing bottom at .7067 will turn the main trend to down.
Watch the price action and read the order flow at .7145 today. Trader reaction to this level will tell us whether the bulls or the bears are in control.
About the Author
James Hyerczykauthor
James Hyerczyk is a U.S. based seasoned technical analyst and educator with over 40 years of experience in market analysis and trading, specializing in chart patterns and price movement. He is the author of two books on technical analysis and has a background in both futures and stock markets.


Advertisement