Despite the uptrend on the daily swing chart, counter-trend selling pressure is helping to drive the AUD/USD lower on Friday. The short-term range is
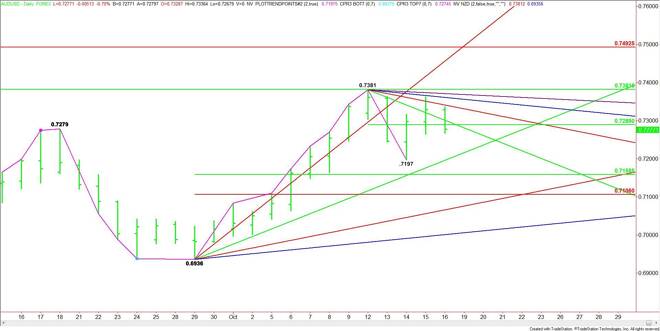
Despite the uptrend on the daily swing chart, counter-trend selling pressure is helping to drive the AUD/USD lower on Friday. The short-term range is .7381 to .7197. Its pivot at .7289 is controlling the short-term direction of the market, making it the key level to watch the rest of the session.
Trading on the weak side of the pivot at .7289 will indicate increasing selling pressure. The daily chart indicates there is plenty of room to the downside if the selling pressure picks up steam. The next major downside target is the minor bottom at .7197. This is followed by a major uptrending angle at .7196.
A sustained move on the strong side of the pivot will indicate the presence of buyers. The first Gann angle target drops in at .7301.
Earlier in the session, the market tested the next downtrending resistance angle at .7341. This is followed by a pair of downtrending angles at .7361 and .7371. The latter is the last major downtrending angle before the .7381 main top.
Although the main trend is up, momentum appears to be shifting to the downside. Watch the price action and read the order flow at .7289 the rest of the session. Trader reaction to this number is likely to determine the direction of the market into the close.
James Hyerczyk is a U.S. based seasoned technical analyst and educator with over 40 years of experience in market analysis and trading, specializing in chart patterns and price movement. He is the author of two books on technical analysis and has a background in both futures and stock markets.