
Advertisement
Advertisement
AUD/USD Forex Technical Analysis – October 21, 2014 Forecast
By:
The AUD/USD posted another inside move on Monday, indicating trader indecision and impending volatility. Traders are probably waiting for the release of
The AUD/USD posted another inside move on Monday, indicating trader indecision and impending volatility. Traders are probably waiting for the release of the economic data from China later today before making a move.
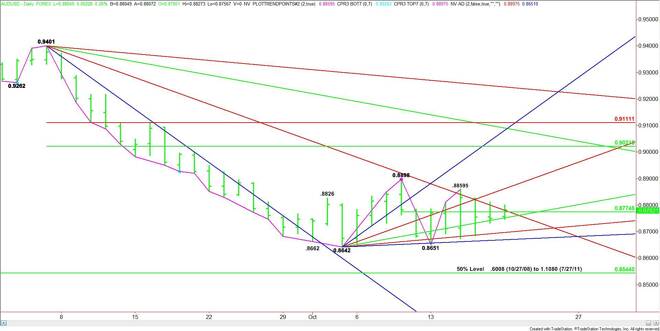
Technically, the market is trading inside a triangle chart pattern which is always indicative of a potential breakout move.
The key price to watch for an upside breakout is a downtrending angle from the .9401 top at .8761 today. Since the market closed at .8782, it is already on the bullish side of this angle, giving the market an upside bias on the opening.
The short-term range is .8651 to .88595. The mid-point of this range at .87745 is controlling the short-term direction of the market. Holding above this level will also indicate that buyers are coming in to support the market. Finally, the market is also trading on the strong side of an uptrending angle from the .8642 bottom at .8762. This is the bottom of the triangle.
Breaking .8762 could pressure the market down to the next two uptrending angles at .8702 and .8672. These are the last two support angles before the main bottoms at .8651 and .8642.
If traders take out the upper end of the triangle at .8761 with conviction then look for a drive into the next angle at .8882. Crossing to the bullish side of this angle will put the market in a position to challenge the last main top at .8898. Taking out this price will turn the main trend to up on the daily chart.
The main range is .9401 to .8642. Its retracement zone at .90215 to .9111 is the next likely upside target.
Two angles cross at .8761 and .8762. The tone of the market will be determined by trader reaction to this price cluster. Breaking out over .8762 with better-than-average volume will be a sign of strength. A failure at this area should lead to renewed selling pressure.
About the Author
James Hyerczykauthor
James Hyerczyk is a U.S. based seasoned technical analyst and educator with over 40 years of experience in market analysis and trading, specializing in chart patterns and price movement. He is the author of two books on technical analysis and has a background in both futures and stock markets.


Advertisement