
Advertisement
Advertisement
AUD/USD Forex Technical Analysis – October 22, 2014 Forecast
By:
After consolidating for several days inside of triangle chart pattern and straddling a short-term pivot, the AUD/USD finally broke out to the upside. The
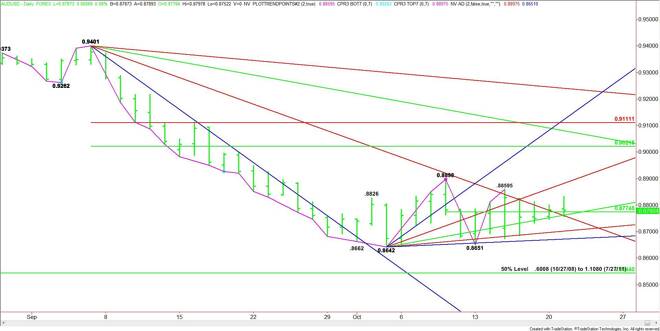
After consolidating for several days inside of triangle chart pattern and straddling a short-term pivot, the AUD/USD finally broke out to the upside. The catalyst behind the move was better-than-expected data from China. The inability to follow-through to the upside following the breakout indicates that the rally was likely short-covering. This could mean another test of support is in order.
The short-term range is .8651 to .88595. The pivot formed by this price is .87745. This price is controlling the short-term direction of the market. Since the market closed on the bullish side of the pivot and the strong side of an uptrending angle at .8772, look for an early upside bias today.
Traders may straddle .87745 throughout the day before deciding on a direction. If this price holds as support, the daily chart indicates there is room to the upside with .8902 the first target. The chart opens up again over this level with the main top at .8898 the next objective. Taking out this price will turn the main trend to up on the daily chart.
If the pivot and support angle at .8772 fails then look for a possible acceleration to the downside. The first target is an uptrending angle at .8707, followed by another at .8675. This is the last support before the main bottom at .8642.
The tone of the market will be determined by trader reaction to .8772.
About the Author
James Hyerczykauthor
James Hyerczyk is a U.S. based seasoned technical analyst and educator with over 40 years of experience in market analysis and trading, specializing in chart patterns and price movement. He is the author of two books on technical analysis and has a background in both futures and stock markets.


Advertisement