BTC-Spot Market Facing Net Outflows
On Monday (April 8), BTC rallied 2.73%. Following a 0.64% gain on Sunday, BTC ended the session at $71,315. BTC extended its winning streak to three sessions.
BTC revisited the $72,500 handle for the first time since March 14 before ending the session below the $72,000 level. BTC-spot ETF market flow data contributed to the retreat.
According to Farside Investors, the BTC-spot ETF market saw net outflows of $245.1 million, excluding iShares Bitcoin Trust (IBIT) flow data.
- Fidelity Wise Origin Bitcoin Fund (FBTC) saw net inflows of $6.3 million on April 8, down from $83.0 million (April 5).
- Bitwise Bitcoin ETF (BITB) saw net inflows of $40.3 million after seeing total net inflows of $47.0 million in the week ending April 5.
- Grayscale Bitcoin Trust (GBTC) saw net outflows surge from $144 million (April 5) to $303 million (April 8).
The GBTC outflow data disappointed, with investors hoping outflows would trend lower. Last week, news hit the wires of Genesis completing its $2.1 billion sale of GBTC shares. Outflow data for Monday suggests selling trends could continue to impact total BTC-spot ETF market flows despite BTC price movements. GBTC saw outflows surge despite BTC revisiting the $72,500 handle.
Nevertheless, investor sentiment toward demand and the bitcoin halving event influenced buyer appetite for BTC.
On Sunday, Ripple CEO Brad Garlinghouse predicted the crypto market would double to $5 trillion by the end of 2024. Garlinghouse based his prediction on demand from the BTC-spot ETF market and falling supply stemming from the Bitcoin Halving Event, saying,
“You’re seeing that (ETFs) drives demand, and at the same time demand is increasing, supply is decreasing. That doesn’t take an economics major to tell you what happens when supply contracts and demand expands.”
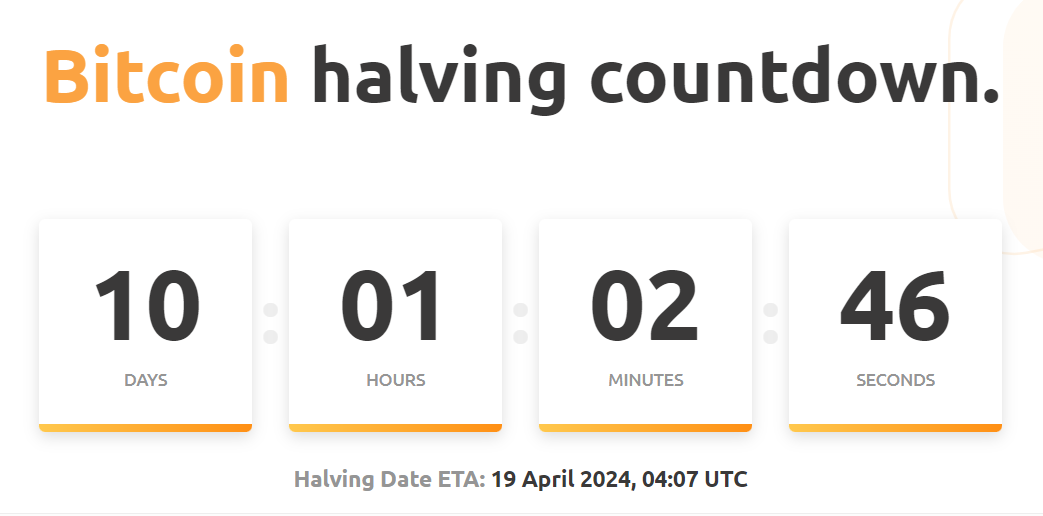
The Bitcoin Halving Countdown Clock signaled ten days until the supply halves.

On Tuesday, BTC-spot ETF market flow data, SEC activity, and Fed chatter need consideration.
Conversely, a BTC drop below the $70,000 handle would bring the $69,000 support level into play. A fall through the $69,000 support level could give the bears a run at the $64,000 support level.
With a 14-Daily RSI reading of 58.32, BTC could break above the all-time high of $73,808 before entering overbought territory.
Bitcoin Price Forecast
Every new Bitcoin analysis as it publishes, today's technical signal and key levels, live price — on one page.
See all Bitcoin forecasts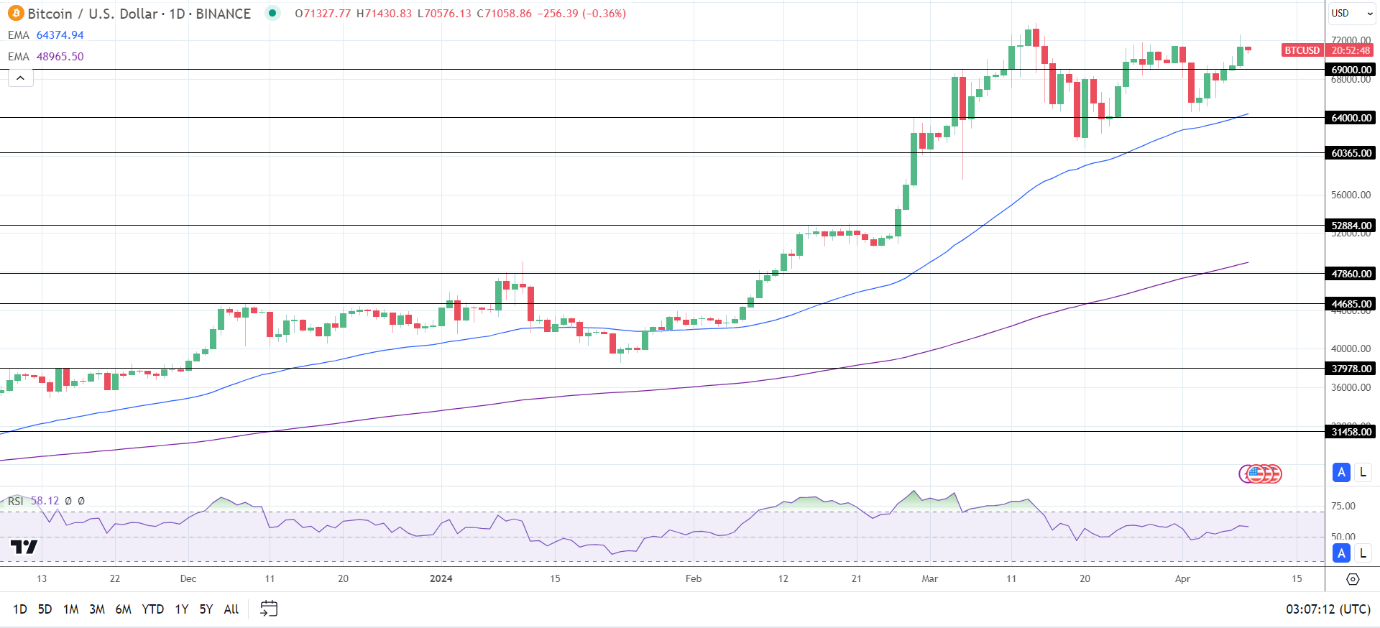
Ethereum Analysis
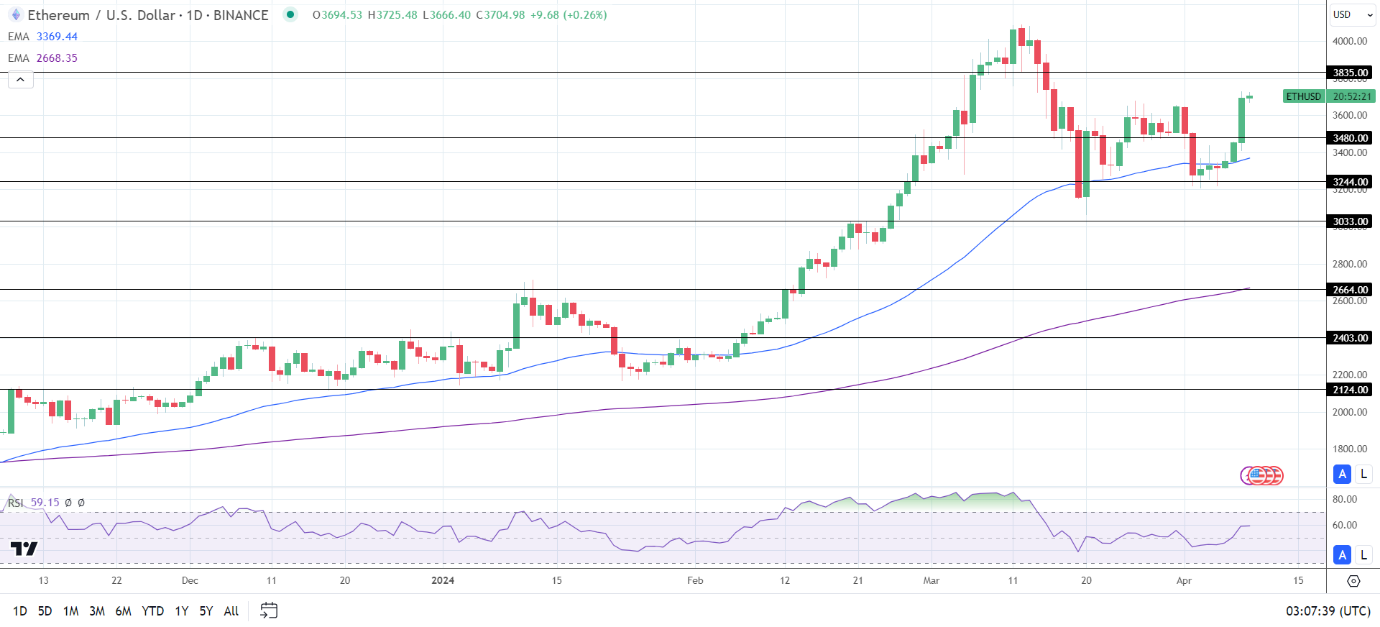
ETH remained above the 50-day and 200-day EMAs. The EMAs affirmed the bullish price signals.
An ETH break above the April 8 high of $3,730 would support a move to the $3,835 resistance level. A breakout from the $3,835 resistance level would bring the $4,000 handle into play.
ETH-spot ETF-related chatter warrants investor attention.
Conversely, an ETH drop below the $3,600 handle could give the bears a run at the $3,480 support level. A break below the $3,480 support level would bring the 50-day EMA into play.
The 14-period Daily RSI reading of 59.41 suggests an ETH return to $4,000 before entering overbought territory.