BTC Lingers Below $65,000 as Fed Rate Cut Bets Ease
On Thursday (June 20), bitcoin (BTC) declined by 0.25%. Following a 0.28% loss on Wednesday, BTC ended the session at $64,862. Significantly, BTC ended the session at sub-$65,000 for the first time since May 14.
Investor sentiment toward the Fed rate path continued impacting buyer demand for US BTC-spot ETFs and BTC.
US initial jobless claims fell to 238k, indicating a stable labor market and reducing expectations for a September Fed rate cut.
The CME FedWatch Tool indicated a 35.9% chance of the Fed maintaining interest rates in September, up from 33.0% on Thursday.”
Rising US 10-year Treasury yields reflected the uncertainty about a September Fed rate cut, advancing by 48 basis points to 4.263%. Conversely, the S&P 500 and the Nasdaq Composite Index declined by 0.25% and 0.79%, respectively. The Dow advanced by 0.77%.
Investor sentiment regarding the Fed’s rate path continued to impact demand for US BTC-spot ETFs and BTC.

Can the US BTC-Spot ETF Market See Net Inflows?
The US BTC-spot ETF market experienced total net outflows of $152.4 million on Tuesday, June 18, marking the fourth consecutive session of outflows. (The US markets were closed on Wednesday, June 19).
The US BTC-spot ETF market faces a fifth successive day of total net outflows on Thursday.
According to Farside Investors:
- Grayscale Bitcoin Trust (GBTC) saw total net outflows of $53.1 million.
- Fidelity Wise Origin Bitcoin Fund (FBTC) had total net outflows of $51.1 million.
- Excluding flow data for iShares Bitcoin Trust (IBIT) and five other issuers, the US BTC-spot ETF market saw total net outflows of $107.9 million on Thursday.
US private-sector PMIs on Friday, June 21, will need to support a September Fed rate cut to halt the spot ETF market outflow streak. A hotter-than-expected US S&P Global Services PMI could extend the US BTC-spot ETF market outflow streak to six sessions.
Economists forecast the US S&P Global Services PMI to fall from 54.8 to 53.7 in June.
Bitcoin Price Forecast
Every new Bitcoin analysis as it publishes, today's technical signal and key levels, live price — on one page.
See all Bitcoin forecastsTechnical Analysis
Bitcoin Analysis
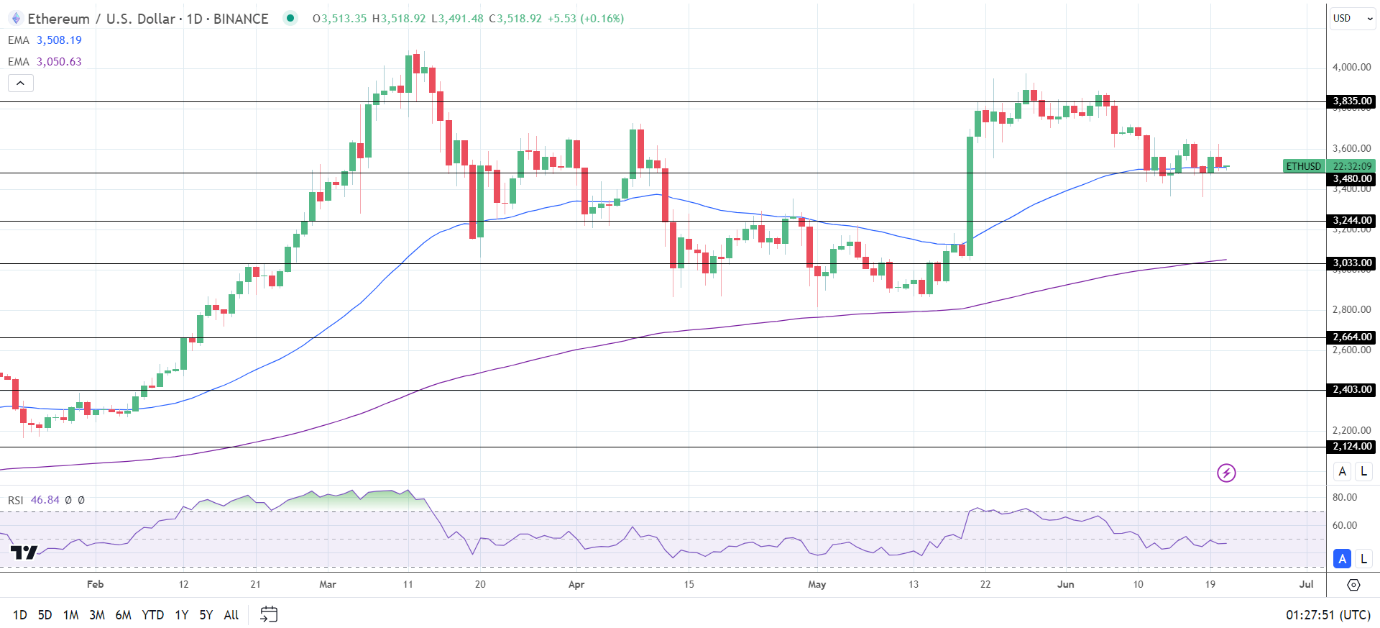
BTC hovered below the 50-day EMA but held above the 200-day EMA, signaling bearish near-term trends but bullish longer-term trends.
A BTC break above the 50-day EMA could allow the bulls to target the $69,000 resistance level. A breakout from the $69,000 resistance level could signal a move toward the $73,808 all-time high.
US Services PMI numbers and US BTC-spot ETF flow data require investor attention.
On the other hand, if BTC falls through the $64,000 support level, it could signal a drop to the $60,365 support level.
With a 38.16 14-Daily RSI reading, BTC could fall below the $64,000 support level before entering oversold territory.
Ethereum Analysis
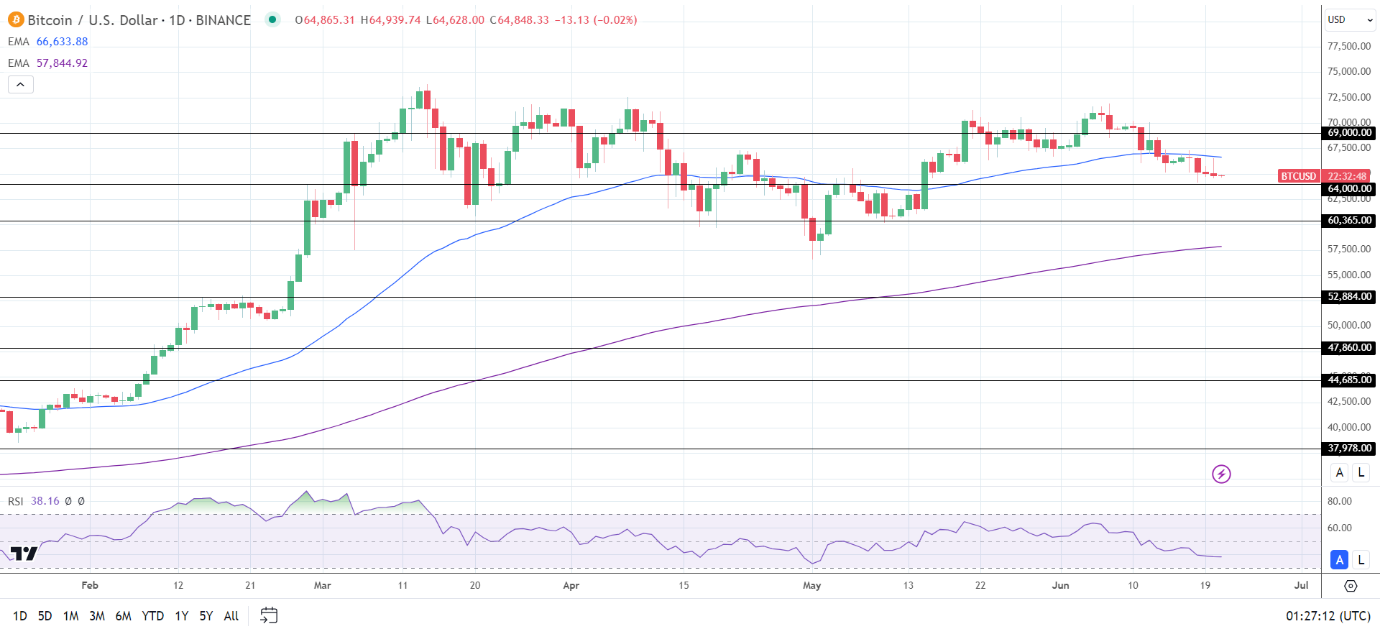
ETH hovered above the 50-day and 200-day EMAs, affirming the bullish price signals.
An ETH break above the $3,600 handle could signal a move toward the $3,835 resistance level.
US ETH-spot ETF-related chatter needs consideration.
Conversely, an ETH fall through the 50-day EMA and the $3,480 support level could give the bears a run at the $3,244 support level.
The 14-period Daily RSI reading, 46.84, suggests an ETH fall to the $3,244 support level before entering oversold territory.