Key Insights:
- On Sunday, bitcoin (BTC) rallied by 8.4%. Reversing a 7.2% loss from Saturday, bitcoin ended the week down 22.7%.
- The Sunday breakout supported recovery from Saturday’s current-year low of $17,601 despite headwinds continuing to pressure the crypto market.
- Technical indicators are bearish, with bitcoin sitting well below the 50-day EMA.
On Sunday, bitcoin (BTC) rallied by 8.44%. Reversing a 7.23% slide from Saturday, bitcoin ended the week down by 22.70% to $20,553.
A bearish start to the day saw bitcoin slide to a low of $17,936 before making a move.
Steering clear of the Major Support Levels, bitcoin rallied to a late high of $20,777.
Bitcoin broke through the First Major Resistance Level at $20,584 before easing back to $20,550 levels.
There were no external market forces to provide bitcoin with direction. Dip-buyers delivered much-needed support, with the US markets closed on Monday.
The pickup in investor appetite came despite risk aversion spreading from the US equity markets. Last week, the NASDAQ fell by 4.78%, with Fed monetary policy and fears of a global recession doing the damage.
While trends were aligned, bitcoin losses had accelerated before Sunday’s relief rally.
Today, the US markets are closed for Juneteenth National Independence Day, leaving the NASDAQ Mini to influence. Later today, investors will need to consider any FOMC member chatter.

Bitcoin Fear & Greed Index Remains Particularly Bearish
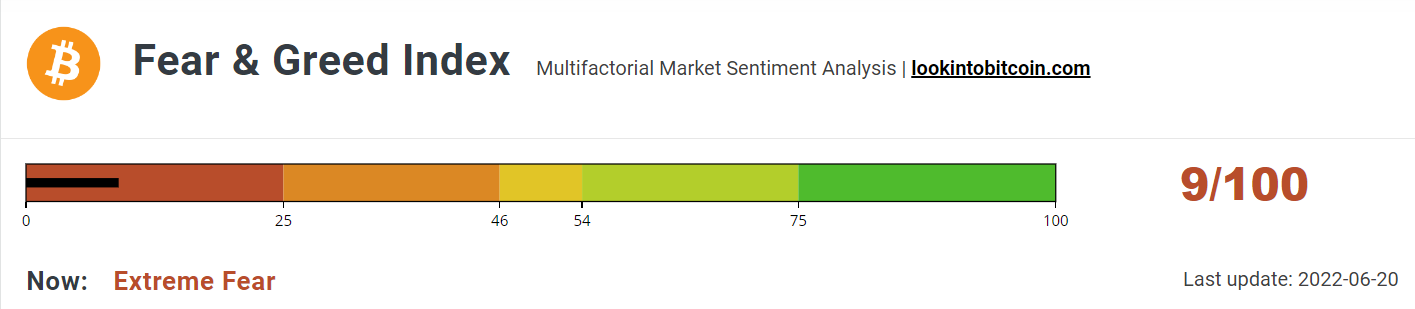
Sunday’s relief rally provided modest support to the Bitcoin Fear & Greed Index. This morning, the Index climbed from 6/100 to 9/100. Despite the upside, the Index remained deep in the “Extreme Fear” zone.
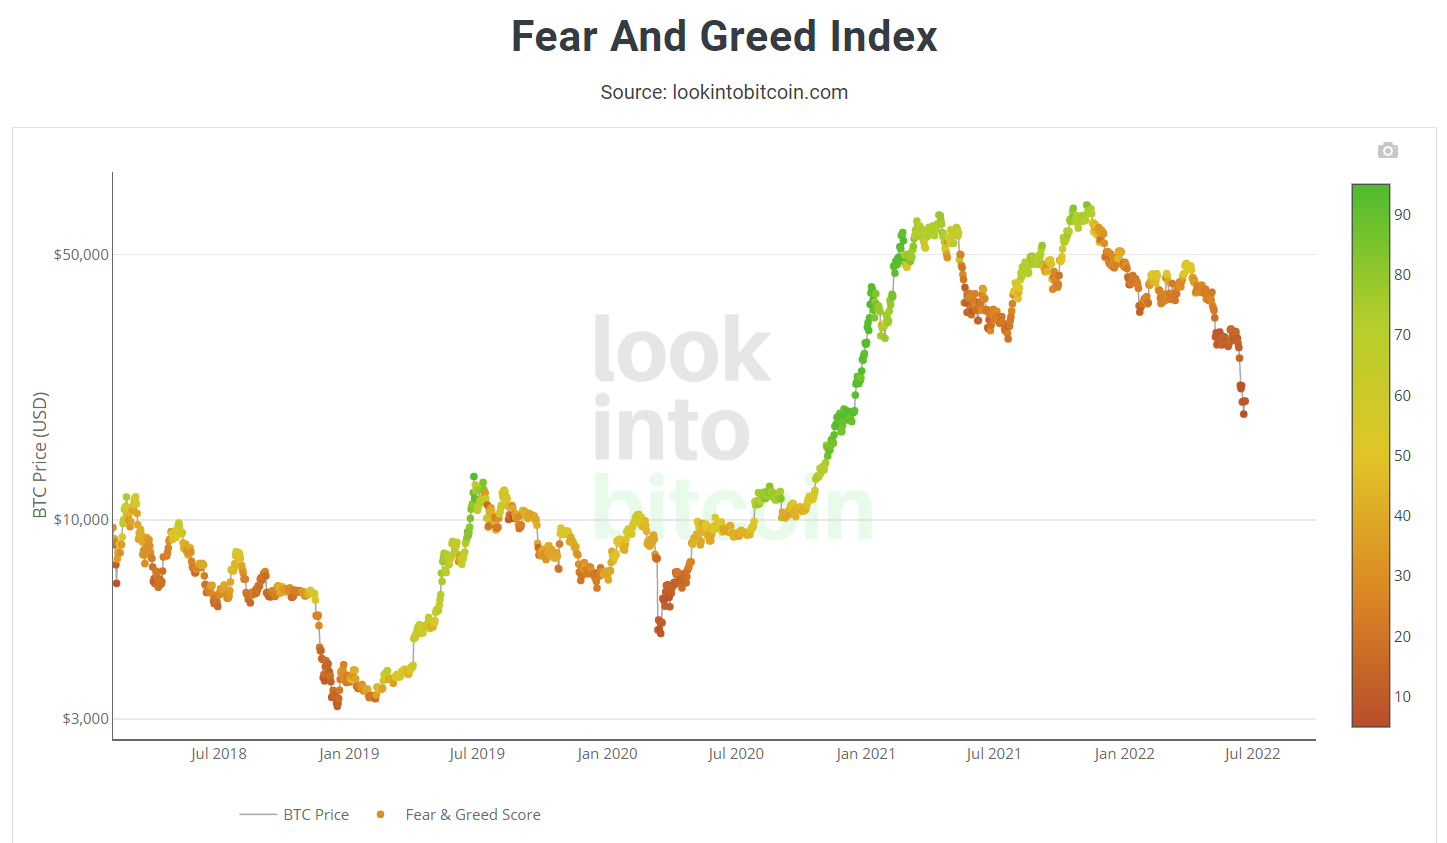
The weekend fall to 6/100 took the Index below March 2020 levels, when bitcoin stood at sub-$10,000.
Investor sentiment towards Fed monetary policy and investor fears of a global recession remain headwinds near-term.
Barring a marked decline in inflationary pressure, volatility will likely persist as investors digest economic data and central bank forward guidance.
Bitcoin Price Forecast
Every new Bitcoin analysis as it publishes, today's technical signal and key levels, live price — on one page.
See all Bitcoin forecastsBitcoin (BTC) Price Action
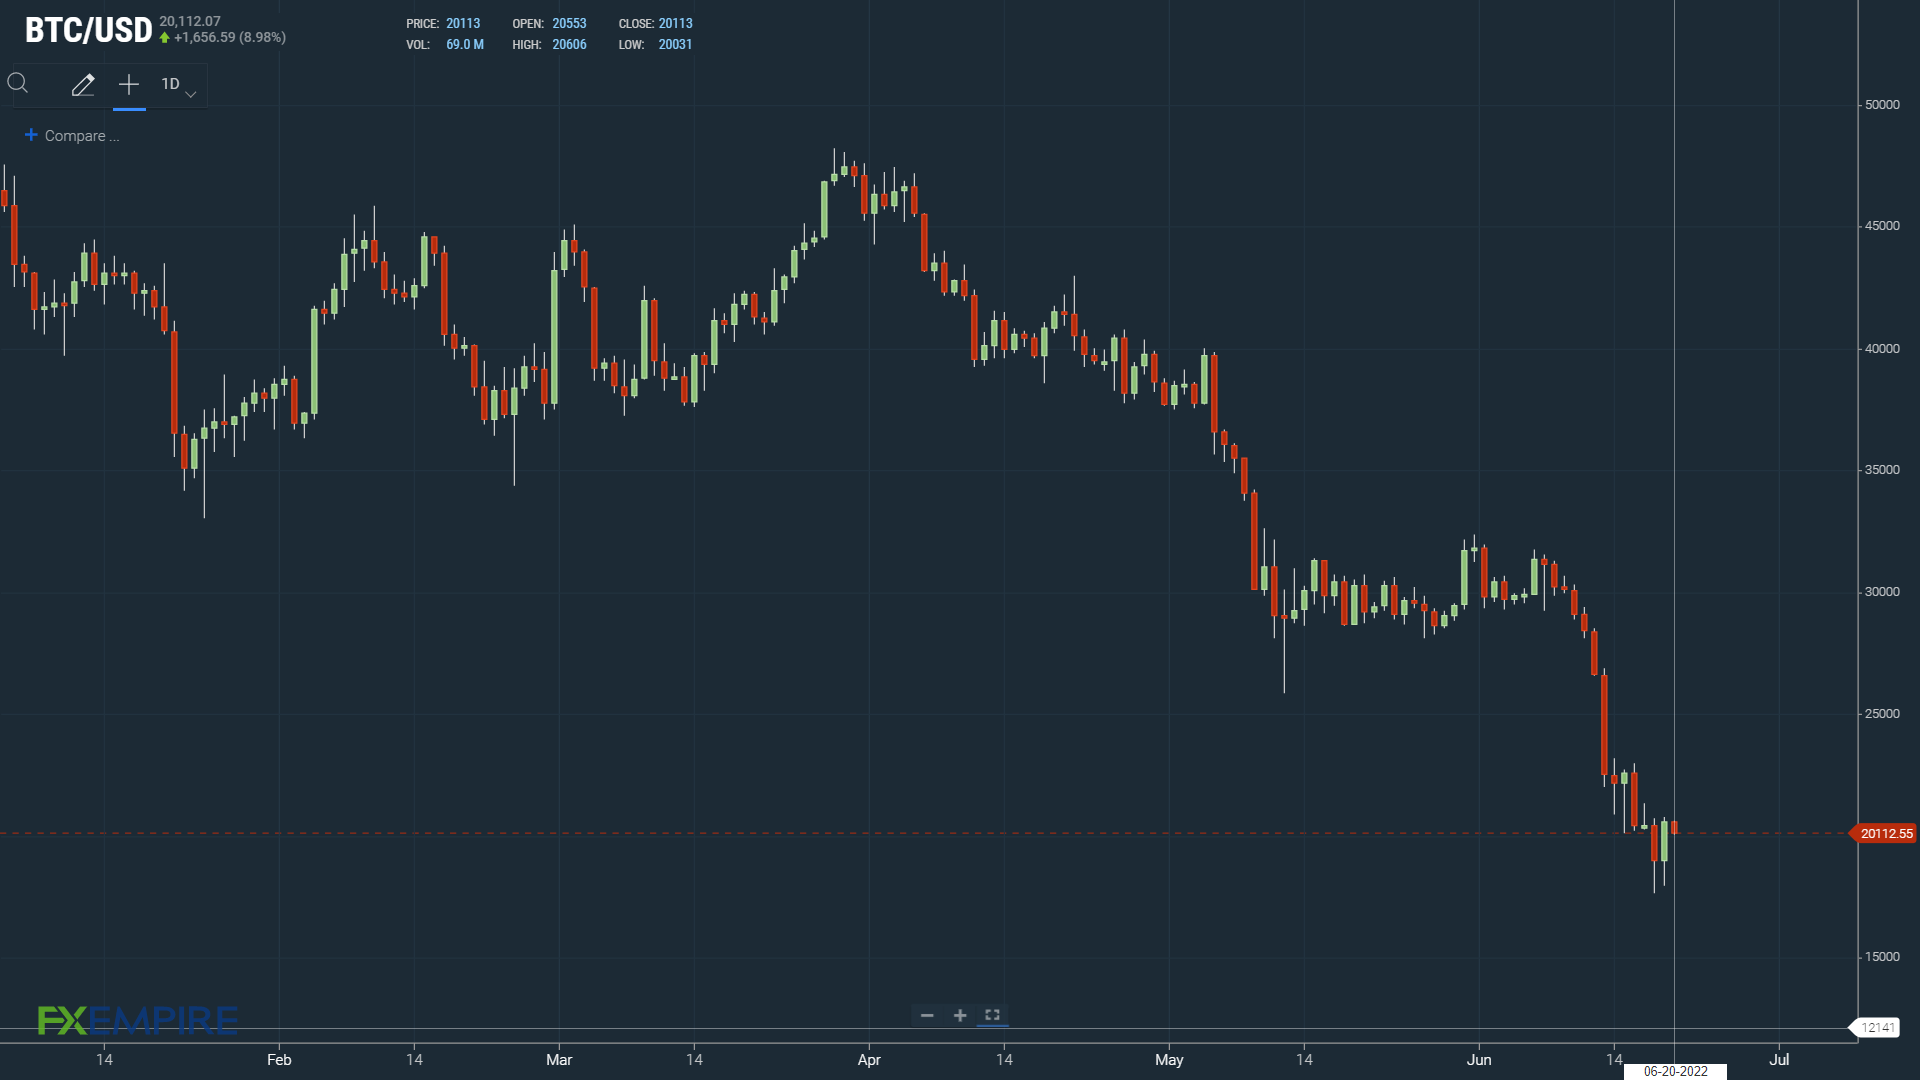
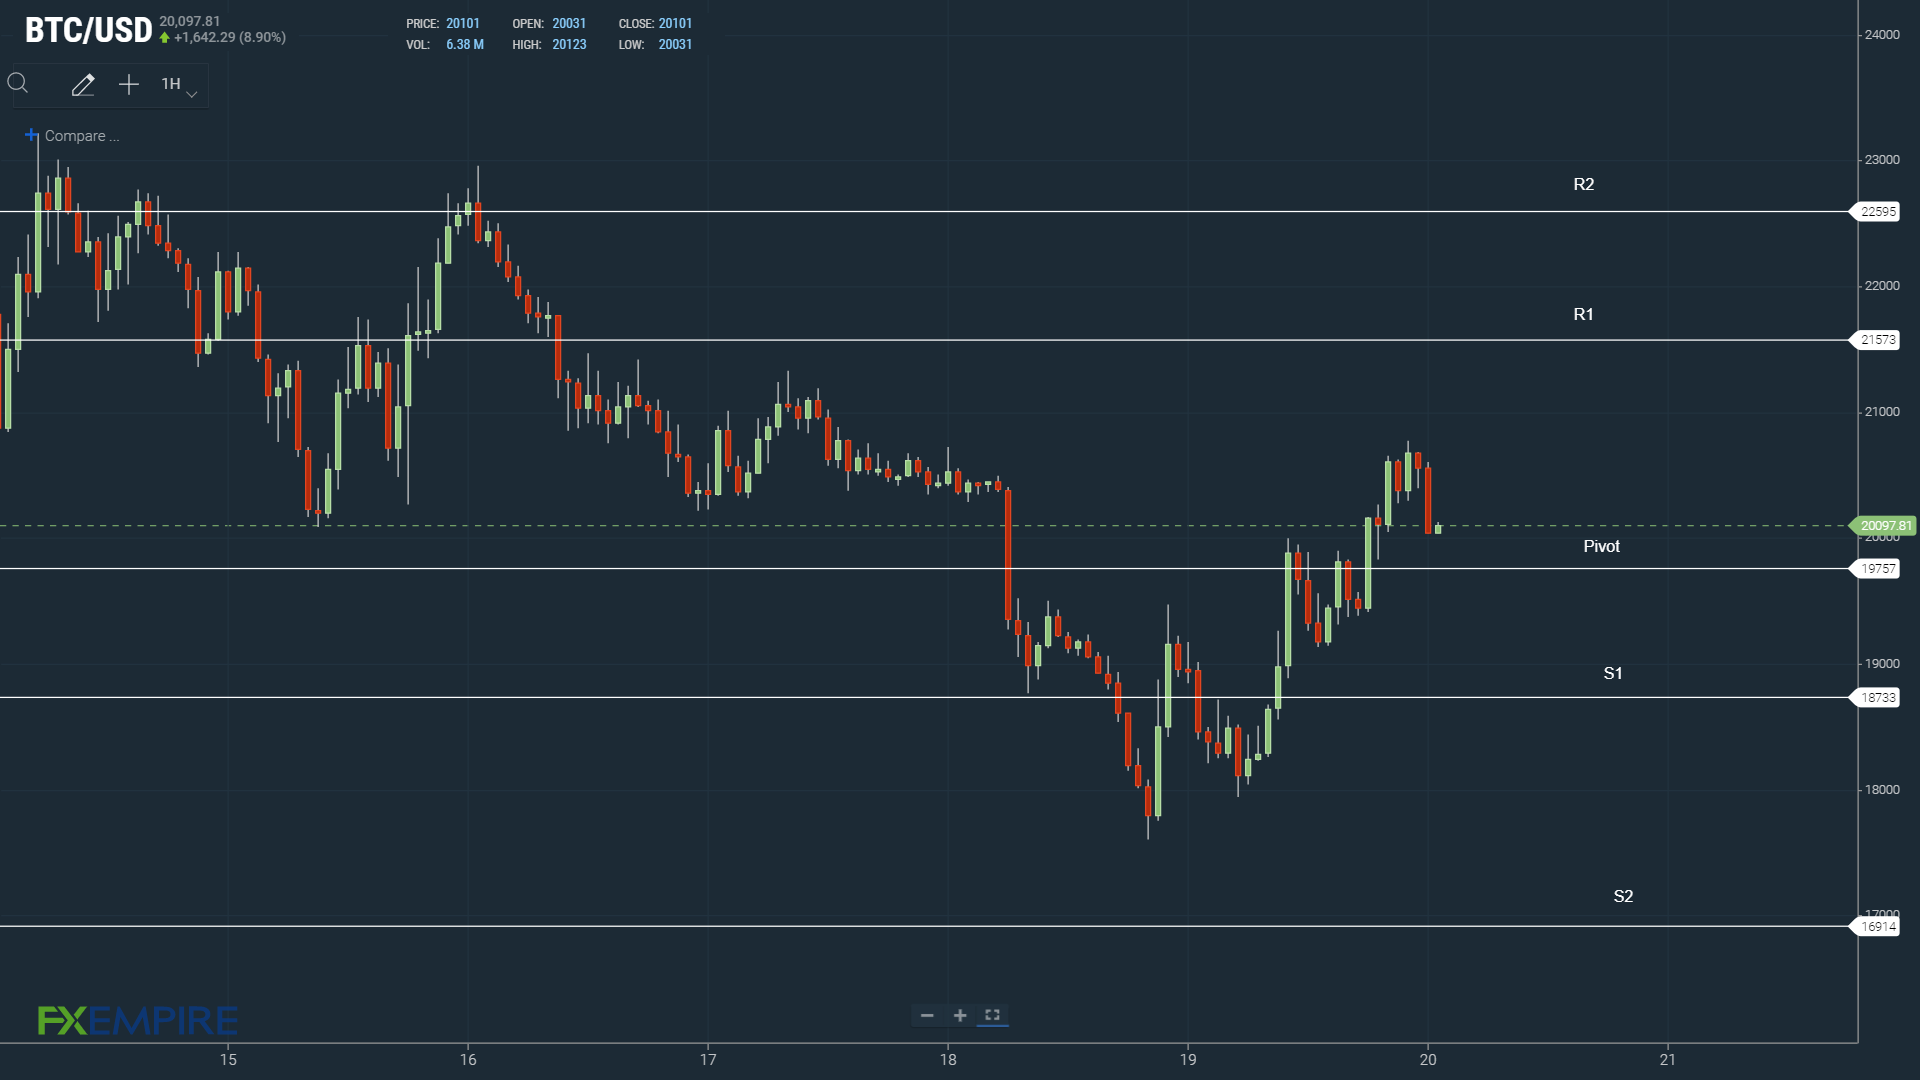
At the time of writing, BTC was down 2.14% to $20,113.
A mixed start to the day saw BTC strike an early high of $20,606 before falling to a low of $20,031.
BTC left the Major Support and Resistance Levels untested early on.
Technical Indicators
Avoiding the $19,757 pivot would bring the First Major Resistance Level at $21,573 into play.
BTC would need plenty of support for a breakout from Sunday’s high of $20,777.
Another extended rally would test the Second Major Resistance Level at $22,595 and resistance at $23,000. The Third Major Resistance Level sits at $25,437.
A fall through the pivot would bring the First Major Support Level at $18,733 in play. In another extended sell-off, bitcoin could retest support at $17,000. The Second Major Support Level sits at $16,914.
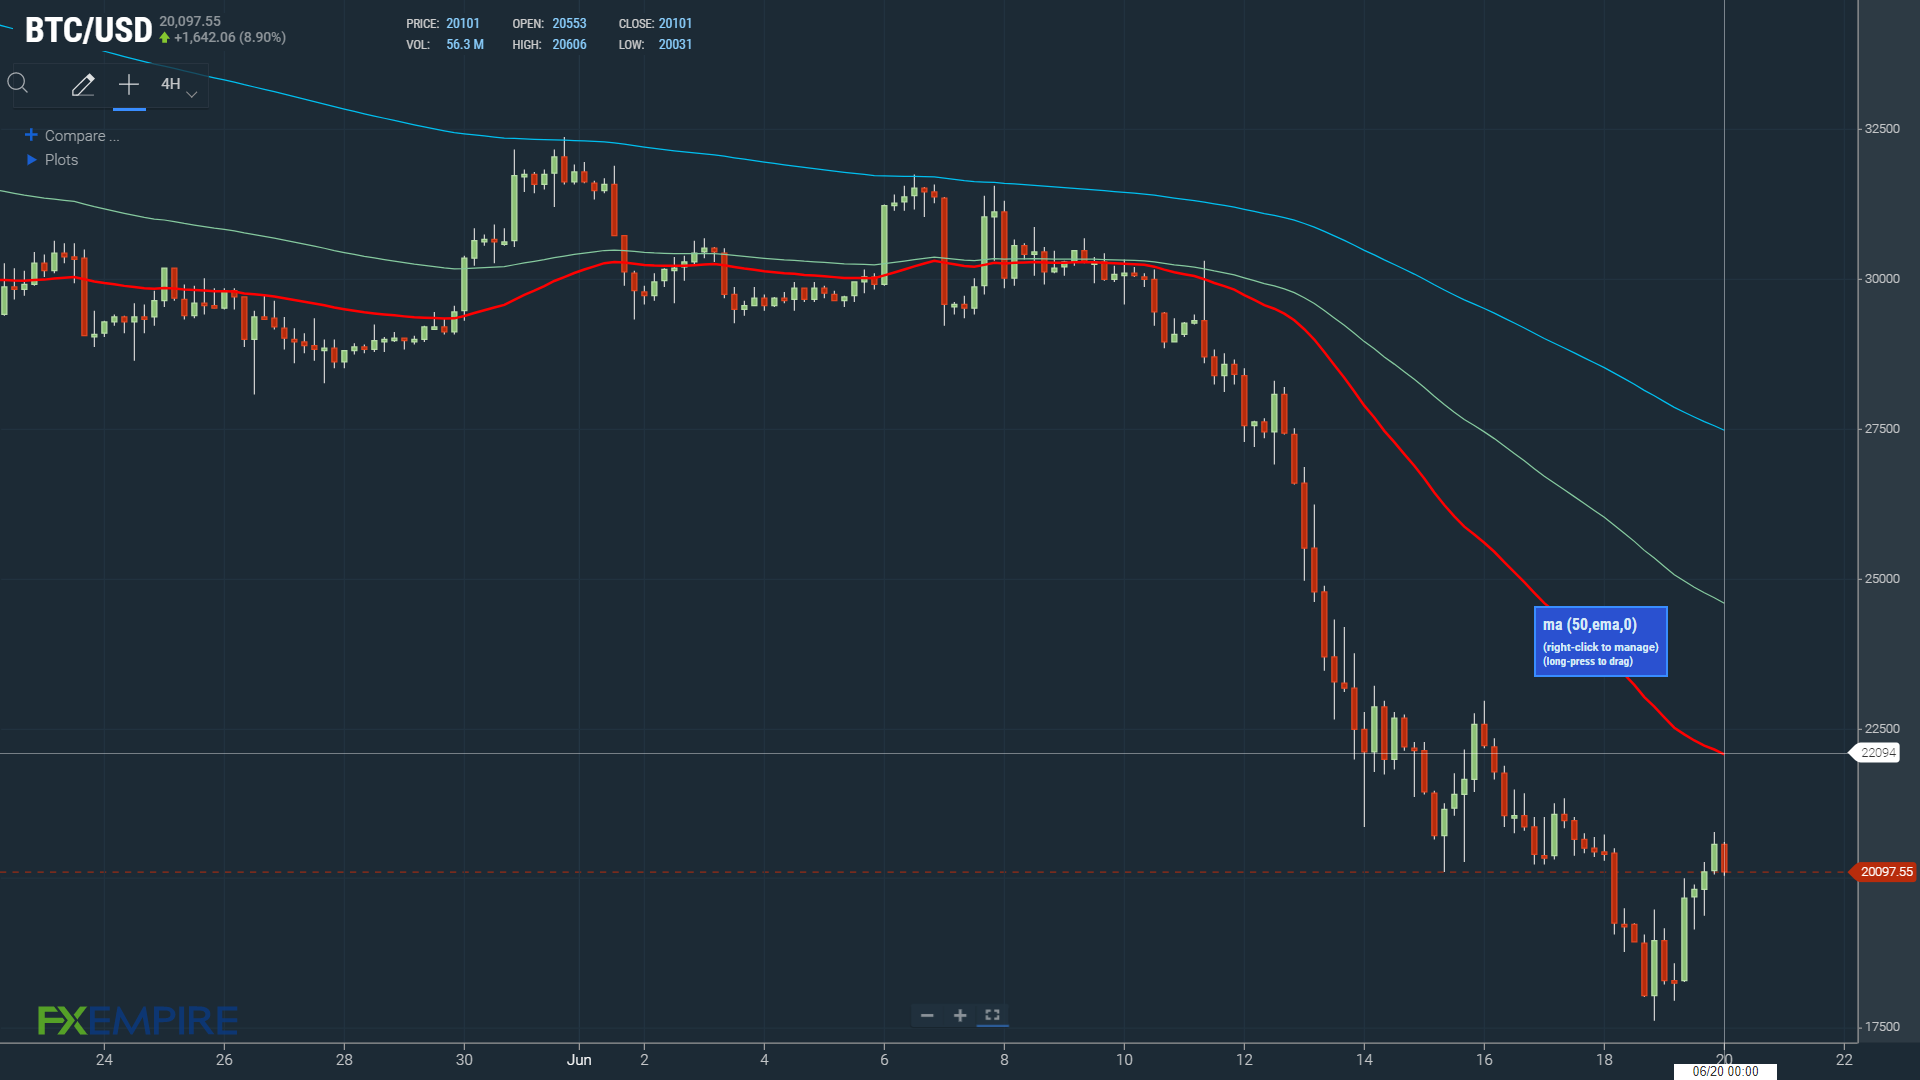
Looking at the EMAs and the 4-hourly candlestick chart (below), it is a bearish signal. Bitcoin sits below the 50-day EMA, currently at $22,094. Today, the 50-day EMA fell back from the 100-day EMA. The 100-day EMA eased back from the 100-day EMA, bitcoin price negative.
A move through the 50-day EMA would give the bulls a look at $25,000.