
Advertisement
Advertisement
Comex Gold Futures (GC) Technical Analysis – August 19, 2015 Forecast
By:
December Comex Gold futures are trading higher during the pre-market session as investors prepare for the release of the U.S. consumer inflation report at
December Comex Gold futures are trading higher during the pre-market session as investors prepare for the release of the U.S. consumer inflation report at 8:30 a.m. ET and the latest Fed minutes at 2:00 p.m. ET. Both are expected to create volatility due to their impact on the Fed’s interest rate decision.
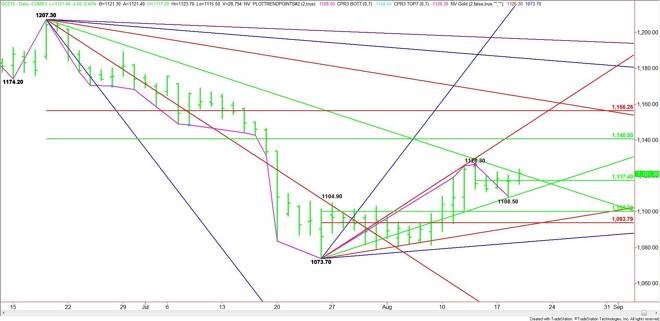
Earlier in the session, gold rallied through yesterday’s high, making $1108.50 a new minor bottom. The main trend is down. A trade through $1126.30 will change the main trend to up.
The short-term range is $1126.30 to $1108.50. Its 50% level or pivot at $1117.40 is controlling the short-term direction of the market.
A sustained move over $1117.40 signals the presence of buyers. The first target is a long-term downtrending angle at $1121.30. The market is currently testing this angle. Crossing to the bullish side of this angle will also be a sign of strength.
The main range is $1207.30 to $1073.70. If the rally continues through $1126.30 then look for a possible acceleration into the 50% level at $1140.50. Overcoming the uptrending angle at $1145.70 will put the market in an extremely strong position with the Fibonacci level at $1156.30 the next target.
A sustained move under $1117.40 will signal the presence of sellers. The first downside target is an uptrending angle at $1109.70. This angle has been guiding the market higher since July 24.
If $1109.70 fails then look for a break into the 50% level at $1100.00. This is followed by a tight support cluster at $1093.80 to $1091.70. The next angle comes in at $1082.70. This is the last major angle before the 1073.70 main bottom.
Based on the current price at $1121.60, the direction of the market on the opening will be determined by trader reaction to the downtrending angle at $1121.30.
The daily chart shows the market has a clear shot at $1140.50 on the upside if buyers take control. Look for a possible break into $1100.00 if sellers gain control.
The 50% level at $1117.40 is also expected to act like a pivot all session. Read the order flow and price action at this price to determine if the buyers or sellers have the upper hand.
About the Author
James Hyerczykauthor
James Hyerczyk is a U.S. based seasoned technical analyst and educator with over 40 years of experience in market analysis and trading, specializing in chart patterns and price movement. He is the author of two books on technical analysis and has a background in both futures and stock markets.


Advertisement