
Advertisement
Advertisement
Comex Gold Futures (GC) Technical Analysis – November 12, 2015 Forecast
By:
December Comex Gold futures are trading slightly higher shortly before the regular session opening. The market is also posting an inside move which means
December Comex Gold futures are trading slightly higher shortly before the regular session opening. The market is also posting an inside move which means there was no follow-through selling after yesterday’s break into a new low for the week. Gold is essentially taking its cues from the U.S. Dollar Index which has also held in a tight range this week.
Volume and volatility could return to average today with the release of the weekly unemployment claims report and because of potential comments from several Fed members including Chair Janet Yellen. They could move the markets especially if their comments are hawkish or if they support a December Fed rate hike. If this is the case then gold could get hit with renewed selling pressure.
If there is no reaction to the Fed speakers then this will indicate that traders are keeping their powder dry ahead of Friday’s U.S. retail sales report. This report will tell the Fed if the consumer is buying into the U.S. economy’s recovery.
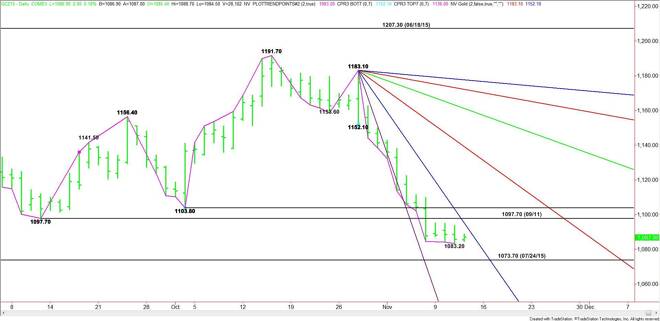
Technically, the main trend is down according to the daily swing chart, however, the price action suggests gold has been treading water most of the week. Gold has inched lower most of the week, but each move has been met with a short-covering rally. Last week’s low was $1084.50. This week’s low is $1083.20. This suggests that the selling pressure this week has been tentative as if short-sellers were shying away from selling weakness.
If $1083.20 is taken out with conviction then there could be an acceleration into the July 24 main bottom at $1073.70. Taking out this level could trigger an even stronger break.
The first upside target is a steep downtrending angle at $1095.10. This angle has been guiding the market lower since October 28. If it fails as resistance then look for a possible rally into the September 11 main bottom at $1097.70 (old bottoms tend to become new tops). This is followed by the October 2 bottom at $1103.80.
The bottom at $1103.80 should act like resistance on the first test, but it is also a trigger point for a possible acceleration to the upside with the next major target coming in at $1139.10.
Today’s price action will be determined by whether volume and volatility return to the gold market. If they do then look for a possible breakout over $1095.10 or a breakdown under $1083.20. Otherwise, continue to look for a sideways trade.
About the Author
James Hyerczykauthor
James Hyerczyk is a U.S. based seasoned technical analyst and educator with over 40 years of experience in market analysis and trading, specializing in chart patterns and price movement. He is the author of two books on technical analysis and has a background in both futures and stock markets.


Advertisement