
Advertisement
Advertisement
Comex Gold Futures (GC) Technical Analysis – November 6, 2015 Forecast
By:
December Comex Gold futures are trading steady-to-slightly better ahead of the cash market opening and the release of the U.S. Non-Farm Payrolls report
December Comex Gold futures are trading steady-to-slightly better ahead of the cash market opening and the release of the U.S. Non-Farm Payrolls report for October. Volume and volatility may be above average today since this report is likely to influence the timing of the next Fed rate hike.
A consensus of investors estimate the economy added 179,000 jobs. The unemployment rate is expected to hold steady at 5.1%.
Average hourly earnings are going to be the most watched part of the report because of its implications for future inflationary trends. It is forecast to rise 0.2%, leaving the annual rate unchanged at 2.2%.
Gold prices have dropped considerably since the Fed issued a hawkish monetary policy statement on October 28 so a bearish number may already be priced into the market. A number above 179K could lead to a continuation of the break, but investors have to be wary of selling weakness at current price levels because of the possibility of a profit-taking reversal to the upside.
A number less than 179K could also trigger a rally because it will give short-sellers an excuse to book profits or to lighten up on the short side.
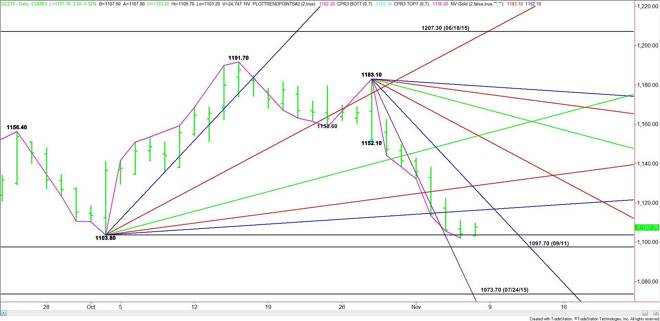
Because of the prolonged move down in terms of price and time, I think a 200K or higher number will be necessary to drive gold prices through the two bottoms at $1103.80 and $1097.70. If they succeed then the move may create enough downside momentum to fuel a potential break into $1073.70, the July 24 main bottom.
The main trend is down according to the daily swing chart. There is no danger of the trend turning to up, but the session begins with gold in the window of time for an upside reversal.
Based on the close at $1104.20, the first major level to watch is the October 2 bottom at $1103.80. Trader reaction to this level will set the tone of the day.
Look for a bullish tone to develop on a sustained move over $1103.80. The first upside objective is a long-term uptrending angle at $1116.30. This is followed by a steep downtrending angle at $1127.10 and another long-term uptrending angle at $1128.80.
The angle at $1128.80 is a potential trigger point for an acceleration to the upside.
A sustained move under $1103.80 will indicate the presence of sellers. The next downside objective is the September 11 bottom at $1097.70. This level is a potential trigger point for an acceleration to the downside with the July 24 main bottom at $1073.70 the next target.
Watch the price action and read the order flow at $1103.80 today. This should tell us whether the bulls or the bears are in control.
About the Author
James Hyerczykauthor
James Hyerczyk is a U.S. based seasoned technical analyst and educator with over 40 years of experience in market analysis and trading, specializing in chart patterns and price movement. He is the author of two books on technical analysis and has a background in both futures and stock markets.


Advertisement