
Advertisement
Advertisement
Comex Gold Futures (GC) Technical Analysis – October 20, 2014 Forecast
By:
December Comex Gold finished lower but inside the wide range formed on October 15. This chart pattern indicates trader indecision. Traders are waiting for
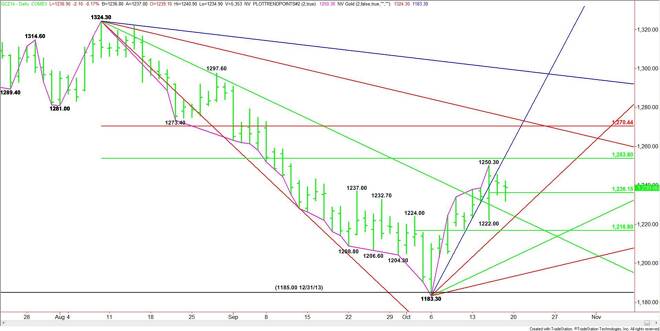
December Comex Gold finished lower but inside the wide range formed on October 15. This chart pattern indicates trader indecision. Traders are waiting for fresh news regarding the direction of the U.S. Dollar.
The short-term range is $1250.30 to $1222.00. Its mid-point at $1236.10 is controlling the short-term direction of the market.
The market could weaken if $1236.10 fails as support with an uptrending angle at $1223.30 the next downside target. Another range has formed between $1183.30 and $1250.30, making its mid-point at $1216.80 another downside target. Should this level fail then look for a sharp break into another uptrending angle at $1203.30.
Trader reaction to the pivot at $1216.80 will be key to the short-term structure of the market because aggressive counter-trend buyers may come in to try to turn the market up from this level. This will produce a potentially bullish secondary higher bottom.
Holding $1236.10 will give the market a slightly bullish tone. The first upside target will be a major 50% level at $1253.80. Overtaking the steep angle at $1263.30 will put the market in a strong position to challenge the major Fibonacci level at $1270.40.
The tone of the market today will be determined by trader reaction to the short-term pivot at $1236.10.
About the Author
James Hyerczykauthor
James Hyerczyk is a U.S. based seasoned technical analyst and educator with over 40 years of experience in market analysis and trading, specializing in chart patterns and price movement. He is the author of two books on technical analysis and has a background in both futures and stock markets.


Advertisement