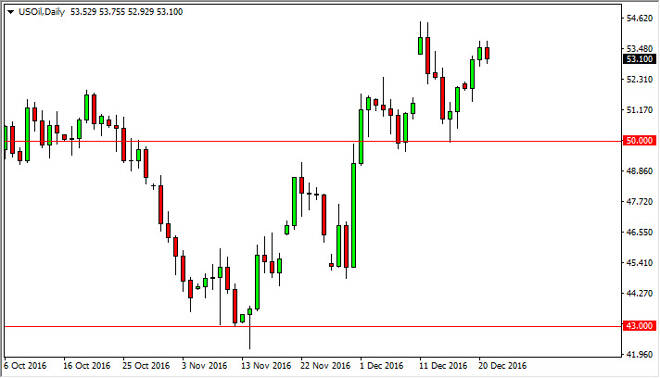
WTI Crude Oil The WTI Crude Oil markets fell slightly on Wednesday as we continue to see quite a bit of choppy trading. At this point in the year,
The WTI Crude Oil markets fell slightly on Wednesday as we continue to see quite a bit of choppy trading. At this point in the year, volatility does tend to dry up due to the fact that a lot of traders will focus more on holidays and less on actual trading. The market seems to have a bit of a floor at the $50 level underneath, and resistance at the $54.50 level above. I think between now and the end of the year we will continue to trade within this area, giving us a relatively obvious range. I will say that I believe there is more of an upward bias than anything else in this market right now, due to the production cut agreement. However, longer-term I still have serious doubts. Short-term buying on the dips is probably about as good as it gets right now.
Brent markets did much the same as you would expect, but quite frankly this is a market that seems to be essentially “dead money” at the moment as the traders continue to focus on holiday rather than trading. I think that the $53 level below is essentially the “floor” in this market, while the $57.50 level above is the “ceiling.” Short-term pullbacks could offer buying opportunities but I am skeptical of hanging onto a trade for any real length of time. I think that a lot of issues continue to plague the market, while on one hand we have the output production cuts making the market a bit more bullish, but longer-term struggles will continue to be an issue as supply will certainly outweigh demand. The higher the price goes, the more likely shale drillers in the United States and Canada will continue to flood the market.
If we can break down below the $53 level, I feel at that point the market will probably reach towards the $50 level next. A break above the $57.50 level will be a sign that the markets going to go reaching for the $60 level longer-term.
Chris is a proprietary trader with more than 20 years of experience across various markets, including currencies, indices and commodities. As a senior analyst at FXEmpire since the website’s early days, he offers readers advanced market perspectives to navigate today’s financial landscape with confidence.