
Advertisement
Advertisement
Crude Oil Forecast December 7, 2016, Technical Analysis
Updated: Dec 7, 2016, 08:50 GMT+00:00
WTI Crude Oil The WTI Crude Oil market went back and forth during the day on Tuesday, ultimately forming a slightly negative candle. However, the $50
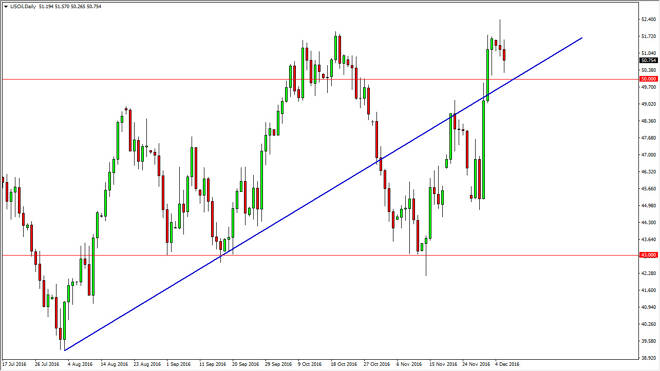
WTI Crude Oil
The WTI Crude Oil market went back and forth during the day on Tuesday, ultimately forming a slightly negative candle. However, the $50 level is an area where we should see quite a bit of support due to not only the large, round, psychologically significant number, but also the uptrend line that had recently been so supportive of this market, and therefore I feel that the $50 level is essentially all you need to know about this market. If we can break down below that level, I believe that we will continue to go lower, but if we find enough support to bounce off it, we should continue to go higher. I believe it is essentially that simple. We also have the Crude Oil Inventories announcement coming out United States today, so having said that I believe it’s only a matter time before we some type of reaction to that announcement, and giving us an idea as to where we are heading next.
Brent
Brent markets continue to hang about the $54 handle, and we have seen the $55 level offer quite a bit of resistance. A break down below the bottom of the candle for the session could send this market lower, perhaps reaching down to the $51 level underneath that. I believe a break above the top of the shooting star during the day on Monday should be an extraordinarily bullish sign. However, if we did break out above there it would only be more of a bullish and more importantly, parabolic move. I still believe that we need to pull back, so even if we do continue higher, I think that you could more than likely find value below. However, if we can break down below the previous uptrend line, that might be enough to get me to start shorting again. I still think that the WTI market breaking down is probably much more interesting and easy to take as a short than the Brent market, so with this I believe it’s a bit overbought, but it’s probably easier to short WTI.
About the Author
Christopher Lewisauthor
Chris is a proprietary trader with more than 20 years of experience across various markets, including currencies, indices and commodities. As a senior analyst at FXEmpire since the website’s early days, he offers readers advanced market perspectives to navigate today’s financial landscape with confidence.


Advertisement