
Advertisement
Advertisement
Crude Oil Forecast December 8, 2016, Technical Analysis
Published: Dec 8, 2016, 04:58 GMT+00:00
WTI Crude Oil The WTI Crude Oil market had a very session on Wednesday, testing the $50 level which of course is a massive support barrier not only based
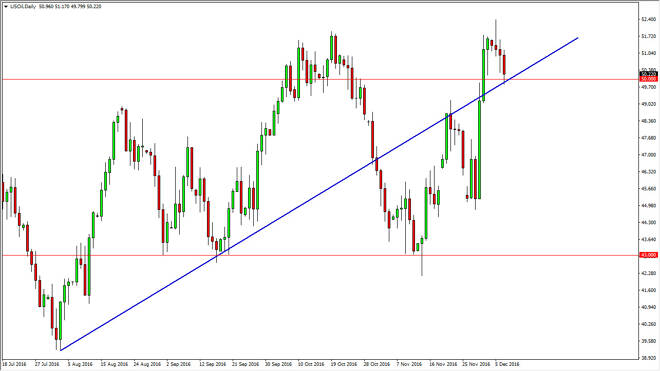
WTI Crude Oil
The WTI Crude Oil market had a very session on Wednesday, testing the $50 level which of course is a massive support barrier not only based upon psychological support, and of course the uptrend line that’s been in the market for a while. That being said, we did not break down below it so I think that the best thing that you can do is to wait for daily close in order to take a position. A break down below the bottom of the uptrend line should send this market looking for the $48 level, but I also recognize that a bounce from here could send the market rent back around towards the $52 level above. If we can get above there, market should continue to go even higher, perhaps reaching towards the $55 level. Pay attention to the US dollar, it’s insert strengthening that might be reason enough for this market to roll over as well.
Brent
The Brent market fell during the day as well, but I think that the real support is probably at lower levels. Because of this, Brent markets might lag a little bit behind the crude oil market if we do see a move higher. Alternately, I believe that it is easier to deal with the WTI Crude Oil market at the moment than it is the Brent market. This is because the Brent market has quite a bit of space between now and the massive support at the uptrend line. An exhaustive negative candle, and of course a bit like a hammer, would be reason enough to turn around and start buying. However, if we break down below the bottom of the uptrend line, that could send this market towards the $50 level, perhaps even lower than that. With this being said, I believe that it’s probably best for you to focus on the WTI Crude Oil market, because it has a much “cleaner” chart at the moment, and much more clear momentum in one direction or the other, and the daily close should give us the information that we need.
About the Author
Christopher Lewisauthor
Chris is a proprietary trader with more than 20 years of experience across various markets, including currencies, indices and commodities. As a senior analyst at FXEmpire since the website’s early days, he offers readers advanced market perspectives to navigate today’s financial landscape with confidence.


Advertisement