
Advertisement
Advertisement
Crude Oil Forecast February 17, 2017, Technical Analysis
Updated: Feb 17, 2017, 03:41 GMT+00:00
WTI Crude Oil The WTI Crude Oil market initially tried to rally during the day on Thursday but failed yet again. Every time we rally this market turns
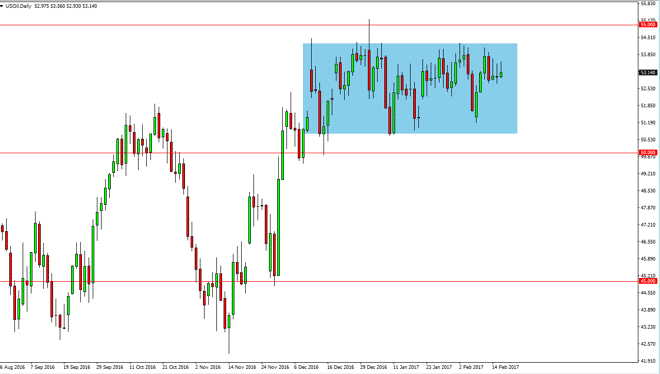
WTI Crude Oil
The WTI Crude Oil market initially tried to rally during the day on Thursday but failed yet again. Every time we rally this market turns around to show signs of exhaustion. The candle looks a bit like a shooting star, just as the Wednesday and the Tuesday candles did. Every time this market rallies it looks like short-term traders are coming in to punish it. With the Baker Hughes Oil Rig Count coming out today, we could get even more bearish news. On a breakdown below the $52.50 level, the market should then drop down to the $51 level. That would simply be a return to the bottom a consolidation, which is a very reasonable expectation. I think that there is a massive amount of resistance at the $54 level, extending all the way to the $55 level. This is a market that continues to show quite a bit of noise, but I think ultimately the sellers will win.
Watch our Crude Oil Video Forecast:
Brent
Brent markets did the same thing during the day, and we have now formed a 3 shooting stars in a row. Because of this, I am a seller but I recognize that we need to get down below the $55.50 level to do so or find some type of short-term rally the we can fade. I believe that ultimately this market will fall as well, because even though OPEC has done the production cuts, it’s only a matter of time before the overwhelming amount of supply ways upon the market. The US dollar has been relatively strong, and that doesn’t help either. Because of this, I think that sooner rather than later the sellers will get involved but we don’t have much in the way of a signal yet. The fact that we formed 3 shooting stars in a row does tell me that the sentiment is starting to get a little bit more negative, and therefore we may see a breakdown given enough time. In the meantime, I continue to play the range that has been so obviously carved out.
About the Author
Christopher Lewisauthor
Chris is a proprietary trader with more than 20 years of experience across various markets, including currencies, indices and commodities. As a senior analyst at FXEmpire since the website’s early days, he offers readers advanced market perspectives to navigate today’s financial landscape with confidence.


Advertisement