
Advertisement
Advertisement
Crude Oil Forecast February 22, 2017, Technical Analysis
Updated: Feb 22, 2017, 05:37 GMT+00:00
WTI Crude Oil The WTI Crude Oil market rallied during the day after gapping higher on Tuesday. We ended up slamming into the $55 level which of course is
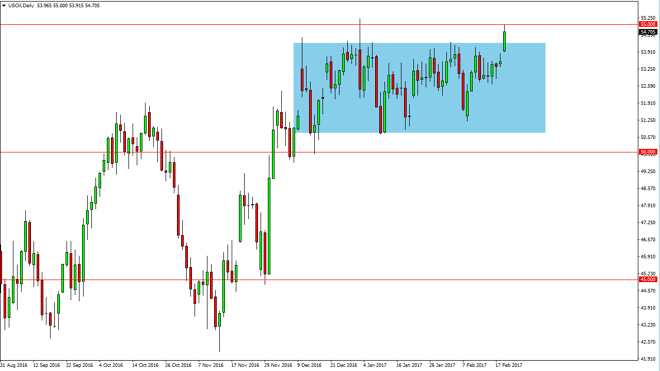
WTI Crude Oil
The WTI Crude Oil market rallied during the day after gapping higher on Tuesday. We ended up slamming into the $55 level which of course is a massive barrier in the uptrend. If we can break above there, and more importantly closable there on a daily chart, I think that the market will then reach towards the $60 level given enough time. In the meantime, I believe that there’s a lot of selling pressure above so short-term scalping the charts might be the way going forward. I spent a large part of the trading session on Tuesday scalping the market to the downside, using the $55 level as a hard barrier. I do think that if we break above there, the market will explode to the upside as it will release a significant amount of inertia.
Crude Oil Price Forecast Video 22.2.17
Watch our Crude Oil Video Forecast:
Brent
Brent markets rallied during the day as well, testing the $57 level. There’s a lot of resistance above, and a pullback should be a nice opportunity for selling the short-term charts. I think that the $55 level underneath is going to be a bit of a magnet for price, so don’t be surprised if the market reaches towards that area again. Alternately, if we can break above the $58 level, the market may try to reach toward $60 next. Quite frankly, a lot of this is due to comments coming out of OPEC as they are pushing for 100% compliance on the output production cuts.
With the market is not paying attention to is the fact that the inventory numbers in the United States and several other countries keep growing. With a large amount of compliance already, it’s likely that the oversupply will eventually outweigh the bullish pressure. However, we could have another leg higher and I have to keep that in the back of my mind currently. If we do fall though, a breakdown below the $55 level should send this market looking for $53 after that. A clearance of that area is a reversal of the intermediate trend and would have me going short for a bit longer timeframe.
About the Author
Christopher Lewisauthor
Chris is a proprietary trader with more than 20 years of experience across various markets, including currencies, indices and commodities. As a senior analyst at FXEmpire since the website’s early days, he offers readers advanced market perspectives to navigate today’s financial landscape with confidence.


Advertisement