Advertisement
Advertisement
Crude Oil Forecast July 24, 2017, Technical Analysis
Updated: Jul 22, 2017, 06:04 GMT+00:00
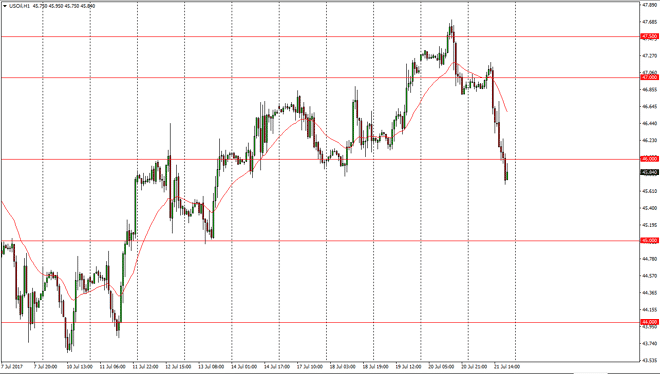
WTI Crude Oil The WTI Crude Oil market initially tried to rally during the day on Friday, but found enough resistance in the $47 level to turn around and
WTI Crude Oil
The WTI Crude Oil market initially tried to rally during the day on Friday, but found enough resistance in the $47 level to turn around and fall significantly. That being the case, the market looks likely to continue to find bearish pressure. When I look at the longer-term charts, I also recognize that there is a lot in the way of bearish pressure, and of course negativity based upon the fact that the market is trying to roll over. I think that the market will continue to find sellers every time it rallies, and I also believe that were going to go looking for the $45 level, and then possibly even the $42.50 level after that. I have no interest in buying this market, and believe that every time we rally it’s a selling opportunity.
Crude Oil Inventories Video 24.7.17
Brent
Brent markets initially tried to rally, but the $49.50 level above continues to offer resistance, we broke down accordingly. Now that we have broken down in this manner, looks like the oil markets cannot get out of their own way, and I believe that longer-term charts are also screaming that were going to go lower. I think $45 is very likely, so therefore every time we rally I’m a seller. I believe that OPEC has lost its ability to control the oil market, and the trading community seems to agree. I think that the market continues to show signs of volatility, but given enough time it’s only a matter of time before the sellers get involved. I think that the $49 level above will be massively resistive, and therefore I would be looking to sell on signs of exhaustion in that region. I also would be willing to add to my bearish position every time we make a fresh, new low, or cross below a round figure such as $48.
About the Author
Christopher Lewisauthor
Chris is a proprietary trader with more than 20 years of experience across various markets, including currencies, indices and commodities. As a senior analyst at FXEmpire since the website’s early days, he offers readers advanced market perspectives to navigate today’s financial landscape with confidence.
Advertisement
