
Advertisement
Advertisement
Crude Oil Forecast June 16, 2017, Technical Analysis
Updated: Jun 16, 2017, 04:21 GMT+00:00
WTI Crude Oil The WTI Crude Oil market went sideways during the Thursday trading hours, as we continue to trade sub $45. Because of this, I believe that
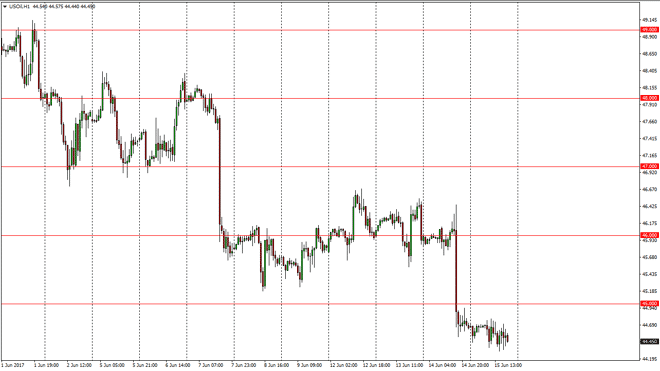
WTI Crude Oil
The WTI Crude Oil market went sideways during the Thursday trading hours, as we continue to trade sub $45. Because of this, I believe that we are eventually going to see selling pressure and of the market, and that short-term rallies will continue to offer short-term selling opportunities. A breakdown below the lows should send this market down to the $43 level after that. The $45 level above is massive resistance, and a break above there could change the attitude of the market for the short term. Ultimately, this is a market that I think will continue to see quite a bit of bearish pressure due to the fact that demand is so low and of course we have such a massive supply glut when it comes to petroleum around the world.
Crude Oil Forecast Video 16.6.17
Brent
Brent markets course are in any different, hovering just below the $47 level during the day on Thursday. I believe that we are looking to sell off, but if we rallied from here, the next major resistance barrier will be the $48 level, an area that I would be very comfortable selling from. With this in mind, I am very bearish of this market, and have no interest in buying at all. I have a longer-term target of $45, which should attract a lot of attention due to the large, round, psychologically significant number aspect of it. A break below there is very bearish, and could send this to the $43 level rather rapidly.
The oversupply in the crude oil market continues the way upon pricing, and I don’t think that’s going to change anytime soon as we are quite frankly running out of areas to put oil in to keep for storage. If my biased changes I will let you know, but quite frankly that’s very unlikely.
About the Author
Christopher Lewisauthor
Chris is a proprietary trader with more than 20 years of experience across various markets, including currencies, indices and commodities. As a senior analyst at FXEmpire since the website’s early days, he offers readers advanced market perspectives to navigate today’s financial landscape with confidence.


Advertisement