WTI Crude Oil The WTI Crude Oil market rolled over a bit during the day on Tuesday, as we continue to test the $45.75 level for support. If we can break
The WTI Crude Oil market rolled over a bit during the day on Tuesday, as we continue to test the $45.75 level for support. If we can break down below there, and I think we will eventually, the market should then go looking towards the $45 level underneath. A break below there send this market looking for the $44 level. Keep in mind that today is the Crude Oil Inventories announcement in the United States, and that could be the catalyst for a breakdown. Rallies at this point should continue to struggle near the $47 handle, which should now be resistance. I like selling short-term rallies, and of course a breakdown below the bottom of the range for the session as oil simply can’t get out of its own way and I believe it’s only a matter of time before we break down anyway.
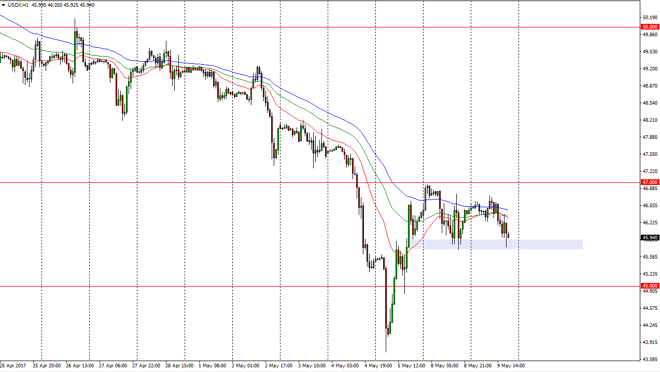
Brent markets rolled over during the session as well, as the 72-hour exponential moving average continues to offer resistance. The $48.50 level offer support as well, pictured in the chart, represented by a lavender rectangle. A breakdown below the $48.40 level should send this market to lower levels, perhaps the $48 level, and then after that to the $46.75 level. Short-term rallies should offer selling opportunities, as we continue to wilt in this market. Oil markets have trouble hanging on the gains, because of the lack of strength that OPEC seems to have. The markets are now focusing on the massive oversupply issues and of course the fact that the US shale producers are attracted to any rally, and will continue to produce rapidly in those moves. I have no interest in buying this market, least not until we can break above the $50 level, something that doesn’t look very likely now.
Chris is a proprietary trader with more than 20 years of experience across various markets, including currencies, indices and commodities. As a senior analyst at FXEmpire since the website’s early days, he offers readers advanced market perspectives to navigate today’s financial landscape with confidence.