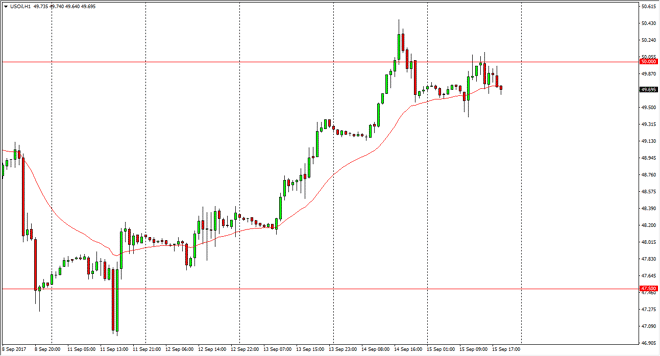
WTI Crude Oil The WTI Crude Oil market was very volatile during the Friday trading session, but continues to struggle near the $50 handle. At this point,
The WTI Crude Oil market was very volatile during the Friday trading session, but continues to struggle near the $50 handle. At this point, it’s not until we close above there on a daily chart that I would be willing to buy this market, and I think a breakdown below the $49.25 level would be a sell signal. In the meantime, it’s likely that the market will be very choppy and difficult to navigate. I’m waiting for some type of impulsivity to get involved.
Brent markets rallied after initially going sideways on Friday, using the $55 level as support. Now that we have pulled back a bit, looks like the buyers are coming back in and perhaps we should go looking towards the $56 level. A break above there census market looking for $57.50. If we were to break down below the $55 level, the market should then go down to the $54 level after that. Expect volatility, that’s what we have seen for some time.
Chris is a proprietary trader with more than 20 years of experience across various markets, including currencies, indices and commodities. As a senior analyst at FXEmpire since the website’s early days, he offers readers advanced market perspectives to navigate today’s financial landscape with confidence.