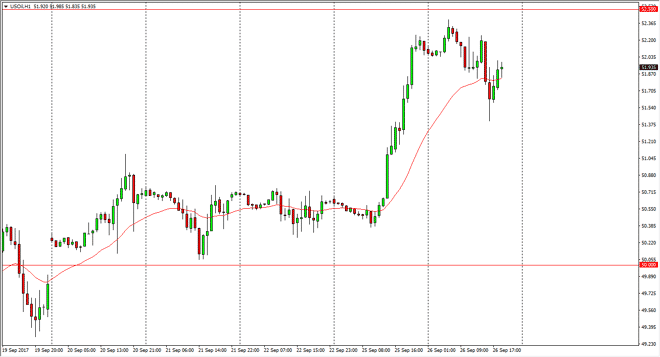
The WTI Crude Oil The WTI Crude Oil market went sideways initially on Tuesday, but then fell towards the $51.50 level. However, it looks as if we are
The WTI Crude Oil market went sideways initially on Tuesday, but then fell towards the $51.50 level. However, it looks as if we are going to find a bit of support in that area, and have bounced. Ultimately though, it also looks like we are trying to roll over after that bounce, so I think that the volatility will continue in the crude oil markets. This probably should do with the US dollar more than anything else, as it is starting to strengthen. We get the Crude Oil Inventories announcement coming out today, so that obviously can influence this market as well. Keep in mind that the market is very volatile, and makes a lot of noise during these announcements, so I expect to see a significant move in one direction or the other. Right now, it looks like we might be a little bit overextended, so softness will probably prevail over the next several hours.
Brent markets also fell during the day, reaching towards the $58 level. This is an area that is of no significant concern, but I think that the $57 level underneath is much more interesting. Ultimately, this is a market that I think should continue to find buyers in that area, and we may see a gentle drift towards that direction. The market got a bit too close to the $60 handle I believe, and with the inventory announcement coming out today, we may have people taking profits as they are bit concerned about potential volatility. Ultimately, this is a market that I think will continue to see a lot of noise, and choppiness of course. I believe trading small positions is about the only way you’re going to be able to deal with the crude oil markets in the short term.
Chris is a proprietary trader with more than 20 years of experience across various markets, including currencies, indices and commodities. As a senior analyst at FXEmpire since the website’s early days, he offers readers advanced market perspectives to navigate today’s financial landscape with confidence.