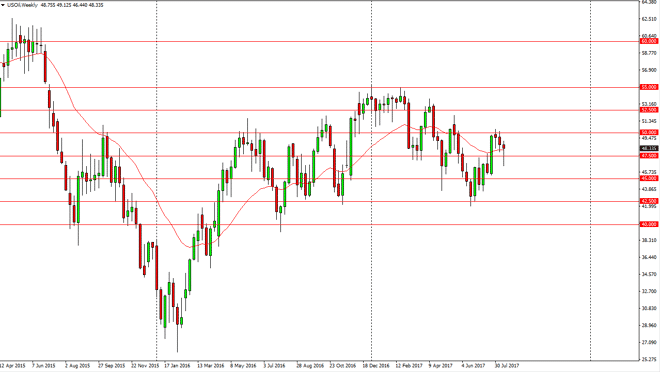
WTI Crude Oil The WTI Crude Oil market initially fell during the week but found a massive amount of bullish pressure on Friday as we broke above to form a
The WTI Crude Oil market initially fell during the week but found a massive amount of bullish pressure on Friday as we broke above to form a hammer. The hammer looks very bullish, and it looks as if the $47.50 level is going to continue to offer massive support. A break above the top of the candle should send this market looking for $50 first, and then eventually towards the $52.50 level. Alternately, if we break down below the bottom of the candle, then I think the market is looking towards the $42.50 level over the longer term. It is going to be volatile, so I think that perhaps daily charts are probably a better way to trade this market from the “long-term.”
Brent markets initially fell during the week, but found enough support at the $50 level to send this market much higher. The bullish attitude on Friday turned everything around, and the hammer for the week suggests that we are going to go higher. However, we have a shooting star from the previous week, so it looks like it will be volatile. A break above the top of the candle should send this market looking for the $55 level, but I recognize that there’s a lot of noise. I also recognize that a breakdown below the $50 level would be very bearish, and send this market looking for at least $47.50, if not lower. Either way, I expect a lot of noise and therefore it’s probably easier to trade this market from a shorter-term chart such as the daily timeframe as a way to trade the longer-term attitude of the market. Oil continues to be very volatile, and I don’t think that’s going to change anytime soon so hanging onto a position is probably going to be very difficult.
Chris is a proprietary trader with more than 20 years of experience across various markets, including currencies, indices and commodities. As a senior analyst at FXEmpire since the website’s early days, he offers readers advanced market perspectives to navigate today’s financial landscape with confidence.