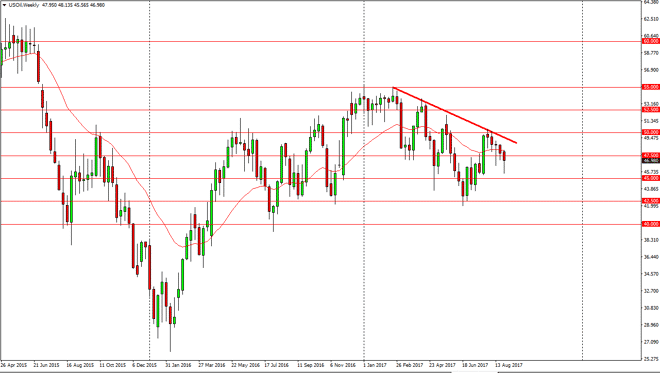
WTI Crude Oil The WTI Crude Oil market fell during most of the week, but found enough support just above the $45 level to turn around and form a hammer.
The WTI Crude Oil market fell during most of the week, but found enough support just above the $45 level to turn around and form a hammer. The hammer is a very bullish sign, and as we have seen several before that, I think that the buyers are finally starting to take a bit of control. With this, I think that the market will continue to find buyers as we reach towards the $50 level. A break above the $50 level is bullish for a longer-term move. Until then, I suspect that is can be difficult to trade this market with any real certainty, as the volatility should continue. A breakdown below the $45 level would be very negative, and have this market looking towards the $42.50 handle underneath.
Brent markets fell yet again, but just as we have seen over the last several weeks, found plenty of support just above the $50 level. By forming several hammers in a row, this is a sign that the market is ready to go higher. Ultimately, the $55 level above is the target. If we can break above there, the market probably goes higher. A lot of the movement that we have seen is due to hurricane Harvey, so it’s hard to tell with the longer-term effective that will be, but currently it looks as if the short-term buyers are getting involved. A breakdown below the $50 level would be negative. They move below there has the market looking for the $47.50 level below which of course should be massively supportive. A breakdown below there would send this market looking for the $45 level. However, looks as if the buyers are starting to flex their muscles, so I believe the buyers are going to lead the way.
Chris is a proprietary trader with more than 20 years of experience across various markets, including currencies, indices and commodities. As a senior analyst at FXEmpire since the website’s early days, he offers readers advanced market perspectives to navigate today’s financial landscape with confidence.