
Advertisement
Advertisement
Crude Oil Pops Higher on Weekly Chart; Is Gasoline Next?
By:
Crude Oil Outlook April Crude Oil is set to finish the week on a five-week high. After establishing support on a short-term pivot earlier in the week, the
Crude Oil Outlook
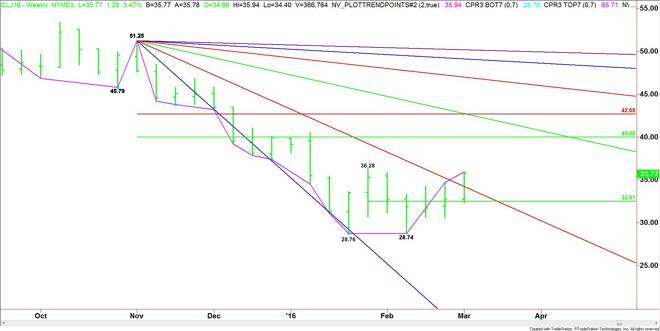
April Crude Oil is set to finish the week on a five-week high. After establishing support on a short-term pivot earlier in the week, the market clawed its way higher until it took out a weekly downtrending angle. This price action created enough upside momentum to challenge the January 28 top at $36.28.
The weekly chart indicates there is plenty of room to the upside to rally. Based on the main range of $51.25 to $28.74, the primary upside target is its retracement zone at $40.00 to $42.65.
Propelling the market at the end of the week was strong U.S. jobs data and follow-through buying after the technical breakout through resistance earlier in the week.
Also helping the market was fresh news from Baker Hughes. The oil field services firm reported that the oil rig count fell by 8 to total 392. At this time last year, drillers were operating 922 rigs in U.S. oil fields.
This news fits in nicely with the bullish news from the weekly U.S. Energy Information Administration report. If you were focusing on the bearish headline number that showed supply was up 10.4 million barrels the week-ended February 26 then you may have missed the bullish daily output number.
The jump in supply didn’t matter this week, however, because the professionals appear to have shifted their focus from the past to the future. Oil supply is being perceived as old news while oil production is being looked at as the future.
This week, the EIA reported that total crude production fell by 25,000 barrels to stand at 9.077 million barrels a day. This is a positive for crude prices, but gains are likely to remain capped because of the huge supply. So if a market is being underpinned by some friendly data and capped by some not-so-friendly data then we essentially have a range bound or sideways market. And that is what we are seeing on weekly charts. Fortunately for the bullish traders, the top of the range is about $40.00.
While some traders are looking at time in their decision process, U.S. shale firms may be looking at price. Earlier in the week, Continental Resources Inc. chief financial official John Hart said the company is prepared to increase capital spending if U.S. crude reaches the low to mid $40s range,
Whiting Petroleum Corp, the biggest producer in North Dakota’s Bakken formation, will stop fracking new wells by the end of March, but would “consider completing some of these wells “if oil reached $40 to $45 a barrel, Chairman and CEO Jim Volker told analysts.
Last year, these and other companies were saying they needed oil above $60 a barrel to produce more. Now they appear to be ready to settle for a lot less.
So going into the new week, we have a possible production freeze by OPEC and friends and further declines in output, especially since the rig count is down, supporting prices and the threat of a rebound in U.S. shale production suggesting a possible cap. When this occurs, perhaps the best thing to do is to look at the chart and try to identify pivot points that will show us where the bulls and the bears are taking control. Right now, the weekly chart pattern indicates crude oil can move to $40 before the sellers come back in.
Gasoline Outlook
April Gasoline futures closed the week in the same position that crude oil closed last week. This market will be testing a breakout area early next week. The first key level is a downtrending angle at 1.3445. The next is the 50% level at 1.3474.
Taking out 1.3474 with conviction and sustaining the move could create enough upside momentum to challenge the Fibonacci level at 1.3998. This price is also the trigger point for an acceleration to the upside with the nearest resistance currently at 1.4570.
We should know early in the week if gasoline futures will follow the same path as crude oil.
About the Author
James Hyerczykauthor
James Hyerczyk is a U.S. based seasoned technical analyst and educator with over 40 years of experience in market analysis and trading, specializing in chart patterns and price movement. He is the author of two books on technical analysis and has a background in both futures and stock markets.


Advertisement