Crude oil prices continued to move higher on Thursday following Wednesday reported from the Department of Energy that showed large drawdown of U.S.
Crude oil prices continued to move higher on Thursday following Wednesday reported from the Department of Energy that showed large drawdown of U.S. inventories, which was a catalyst for the latest rally. Upside risk remains however, following Saudi Arabia’s plan to cut its exports by up to 1,0 million barrels per day going forward, beginning in August.
Crude oil prices broke out above a downward sloping trend line that connects the highs in April to the highs in May and comes in near 48.80. This is now short-term support along with the 10-day moving average at 47.17. Resistance on crude oil prices is now seen near the 200-day moving average at 51.39. Momentum remains positive as the MACD (moving average convergence divergence) histogram prints in the black with an upward sloping trajectory which points to higher prices for crude oil. The relative strength index (RSI) which is a momentum oscillator that measures accelerating and decelerating momentum, broke out and moved higher with price action which reflects accelerating positive momentum.
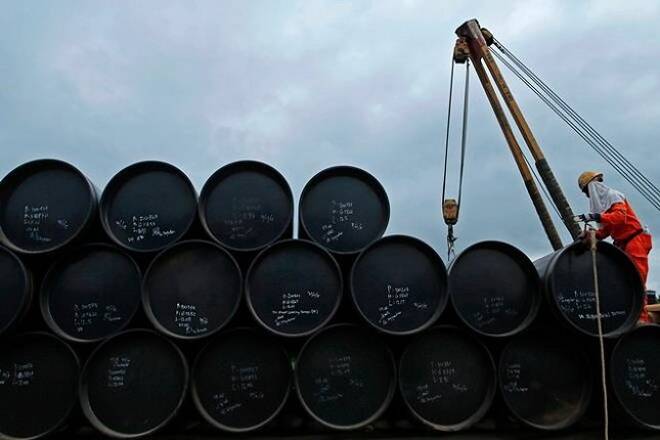
OPEC exporter Saudi Arabia on Monday announced export limits at 6.6 million barrels per day for August a million barrels lower than its figures for the same month last year. Nigeria, one of two African nations exempt from the November production quotas, also vowed to cap output once it reaches 1.8 million barrels per day later this year. The Saudi’s plan is to attack the inventories in the United States and Europe, and while production cuts did not seem to make a difference, export cuts are hitting imports and driving down inventories.
According to the Energy Information Administration, U.S. crude oil imports averaged over 8.0 million barrels per day last week, up by 48,000 barrels per day from the previous week. Over the last month, crude oil imports averaged over 7.8 million barrels per day, 4.2% below the same month year over year.
The decline in imports along with a drop in U.S. domestic production led to a drop-in inventory. The EIA reported that U.S. commercial crude oil inventories decreased by 7.2 million barrels from the previous week. This compares to the 2.2 million drop expected by analysts, and a 10.2 million barrel decline reported by the API on Tuesday. Gasoline inventories decreased by 1.0 million barrels last week, while distillate fuel inventories decreased by 1.9 million barrels last week. Total commercial petroleum inventories decreased by 9.4 million barrels last week.
Demand has picked up. The EIA reported that total products demand over the last month averaged about 21.2 million barrels per day, up by 4.6% from the same period last year. Over the last month, gasoline demand averaged over 9.7 million barrels per day, nearly unchanged from the same period last year. Distillate fuel demand averaged over 4.2 million barrels per day over the last month, up by 13.2% from the same period last year. Jet fuel demand is up 10.7% compared to the same four-week period last year.
U.S. durable goods orders bounced 6.5% in June following the revised 0.1% May decline. Transportation orders boosted the headline, surging 19.0% following the prior 1.6% drop which was revised from -3.0%. Excluding transportation, orders were up 0.2% versus 0.6% previously which was revised from 0.3%. But, nondefense capital goods orders excluding defense dipped 0.1% from the prior 0.7% gain which was revised from 0.2%. Shipments were unchanged in June after rising 1.2% in May which was revised from 1.0%. Nondefense capital goods shipments excluding aircraft were up 0.2% from 0.4% which was revised from 0.1%. Inventories rose 0.4% from 0.1%. The inventory-shipment ratio rose to 1.68 from 1.67. This is a pretty solid report thanks to transportation orders, and while the non-defense capital goods orders component was a little disappointing, the upward revision to May was supportive.
Canada average weekly earnings grew 0.2% in May after the 0.3% month comparable gain in April. Earnings grew at a 2.0% year over year pace in May following the 1.9% pace in April and 1.0% clip in March. That is the fastest growth pace since April of 2015’s 2.4% gain and puts the measure roughly in the middle of the -0.2% to +4.6% growth range seen since 2009. Employment improved 19.6k in May after the slim 1.3k gain in April.
David Becker focuses his attention on various consulting and portfolio management activities at Fortuity LLC, where he currently provides oversight for a multimillion-dollar portfolio consisting of commodities, debt, equities, real estate, and more.