Bullish Reversal Signals Early Trend Improvement
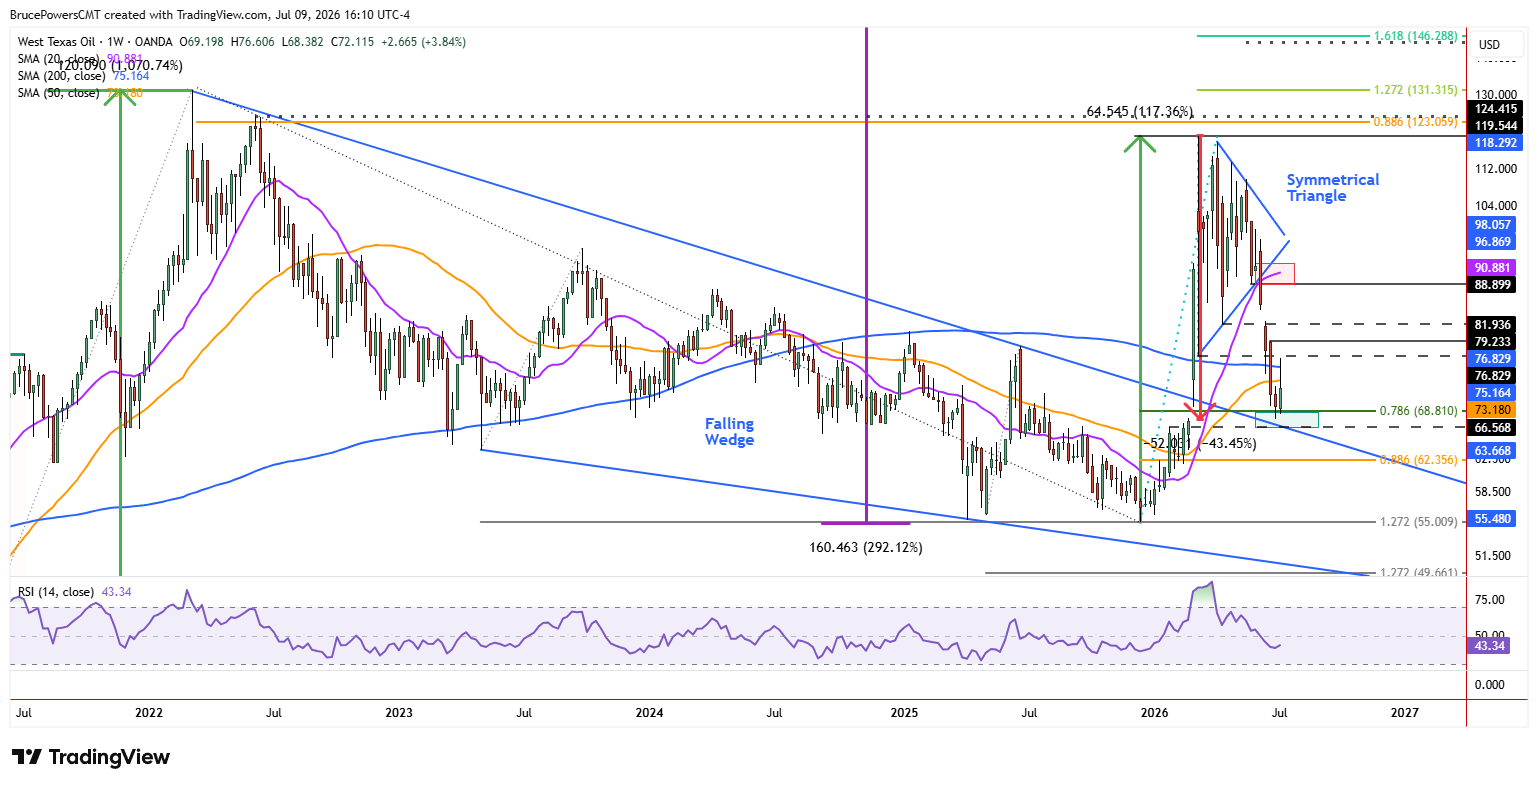
Crude oil triggered a one-week bullish reversal this week with a rally above last week’s high of $72.37. The bullish signal will be confirmed on a weekly basis if Friday’s session closes above the level. This was the first week out of seven that saw a rise above the prior week’s high. Also, a higher weekly low was generated for the first time in five weeks. These are signs of improving bullish momentum following last week’s trend low of $67.73.

Fibonacci Support Suggests Correction May Be Complete
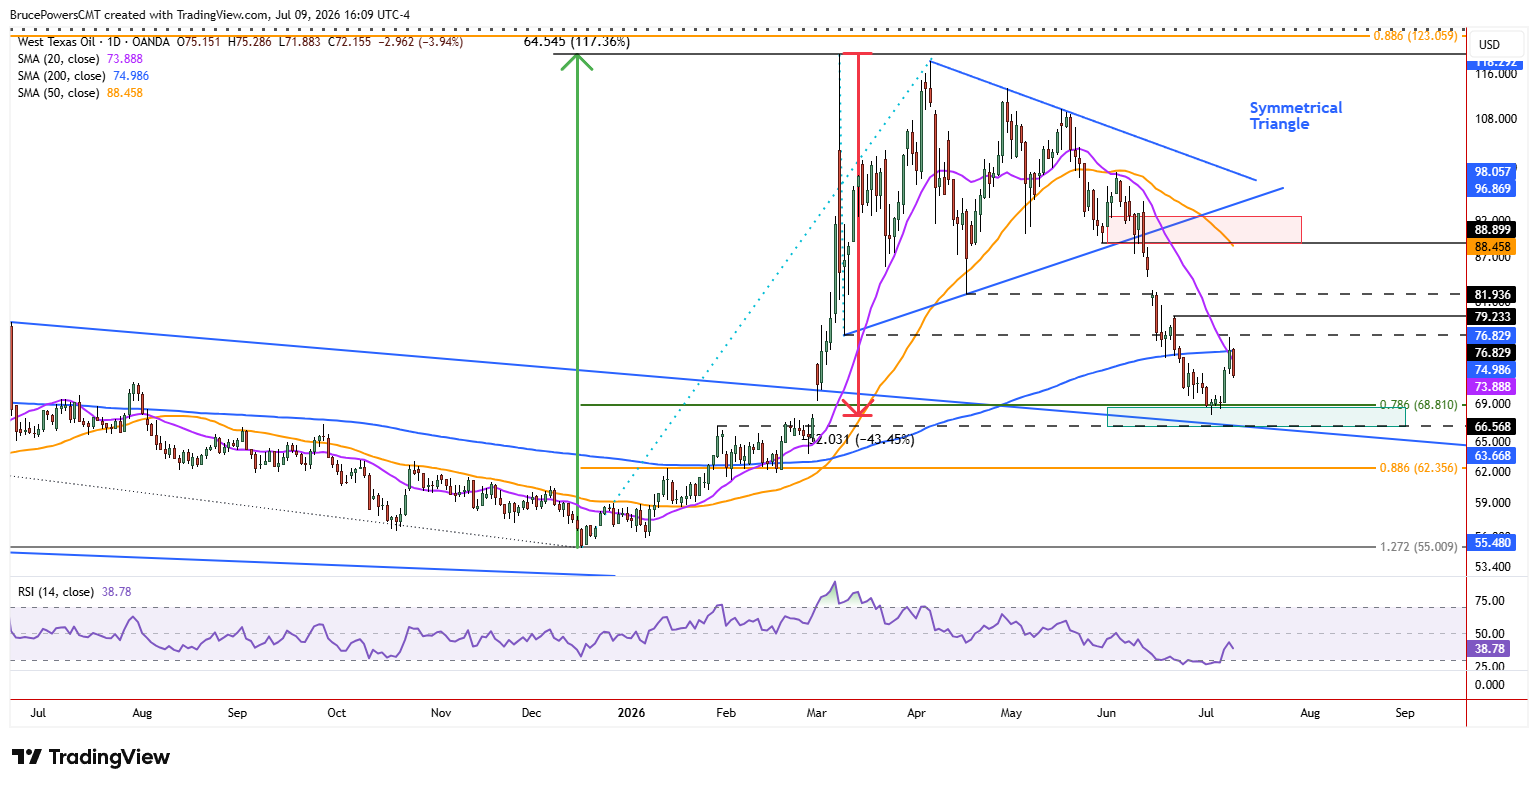
A 78.6% Fibonacci retracement of the prior advance completed near that low at $68.81, suggesting that the bearish retracement may have completed based on Fibonacci analysis. This week’s bullish price action suggests that it did, but further confirmation of strength is still needed. Therefore, while the early reversal signals are encouraging, crude oil must overcome nearby resistance levels to confirm that a larger recovery is developing.
Resistance Zone Challenges Recovery Momentum
An initial advance following last week’s low hit a high of $76.61 on Wednesday, successfully testing the $76.83 spike low support zone from March 10 as resistance. That low has added significance since it was the first swing low established after the March peak. Additionally, key dynamic resistance is marked by the 200-day moving average near $78.61. Although it was reclaimed briefly intraday on Wednesday, the closing price remained near resistance from that average. This shows that longer-term trend resistance remains a significant hurdle for buyers.
On Thursday, however, a one-day bearish reversal triggered with the lower daily high of $75.29 confirming resistance near the 200-day average. The area near the 200-day average is also reinforced by the 20-day moving average near $73.90. Resistance near those two averages shows the downtrend is being retained and downward pressure remains.
Recovery Path Depends on Breaking Higher Resistance
Nonetheless, crude oil bounced from a strong support zone that completed a test of prior resistance for a long-term falling wedge pattern that broke out on March 2. Therefore, short-term weakness may resolve to the upside. A deeper pullback from Wednesday’s lower swing high of $76.61 could lead to a higher swing low. If that occurs, then a breakout above $76.61 looks more likely to hit higher targets.
WTI Crude Oil Price Forecast
Every new WTI Crude Oil analysis as it publishes, today's technical signal and key levels, live price — on one page.
See all WTI Crude Oil forecastsPrior support from a symmetrical triangle consolidation pattern near $88.90 is the primary upside target if bullish momentum improves. However, before that price area is tested as resistance the next two targets of $79.23 and $81.94 need to be recovered. The first level is a lower swing high and the second a prior higher swing low. A successful move through these intermediate resistance levels would strengthen the case that the recent low represented the completion of the bearish retracement and the beginning of a broader recovery.
If you’d like to know more about how commodity markets work, please visit our educational area.