Long-Term Bottoming Pattern Nears Decision Point
The technical outlook for Viking Therapeutics, Inc. (VKTX), a clinical-stage biopharmaceutical company, has been improving over the past month, suggesting that a breakout from a long-term bottoming formation may be getting closer. Signs of improving demand are evident, but it remains unclear whether a pullback or consolidation might occur before another breakout attempt. Some signs of digestion of recent gains before another breakout attempt may be the final hurdle before the long-term bottoming pattern is resolved.
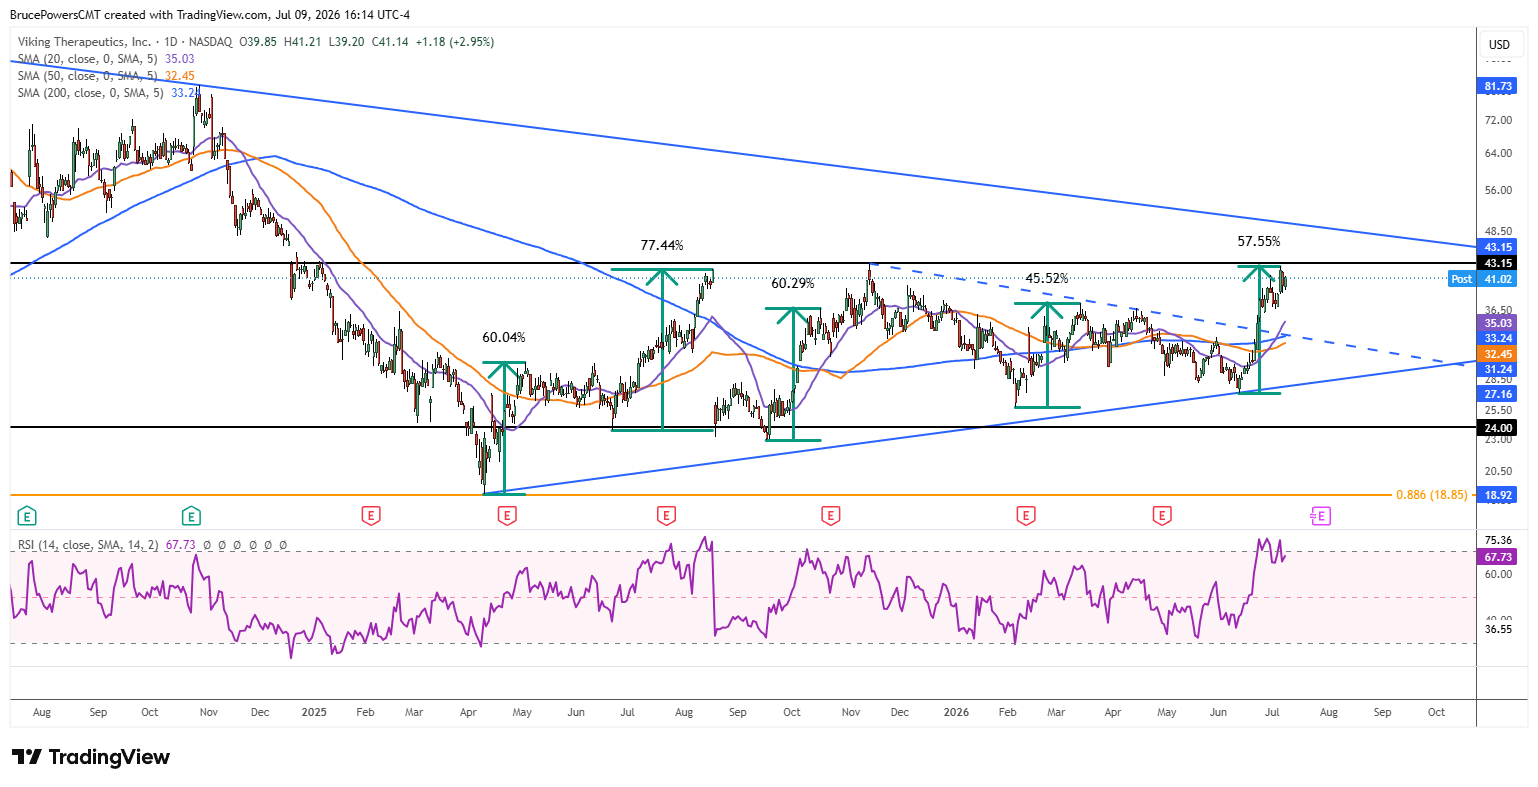
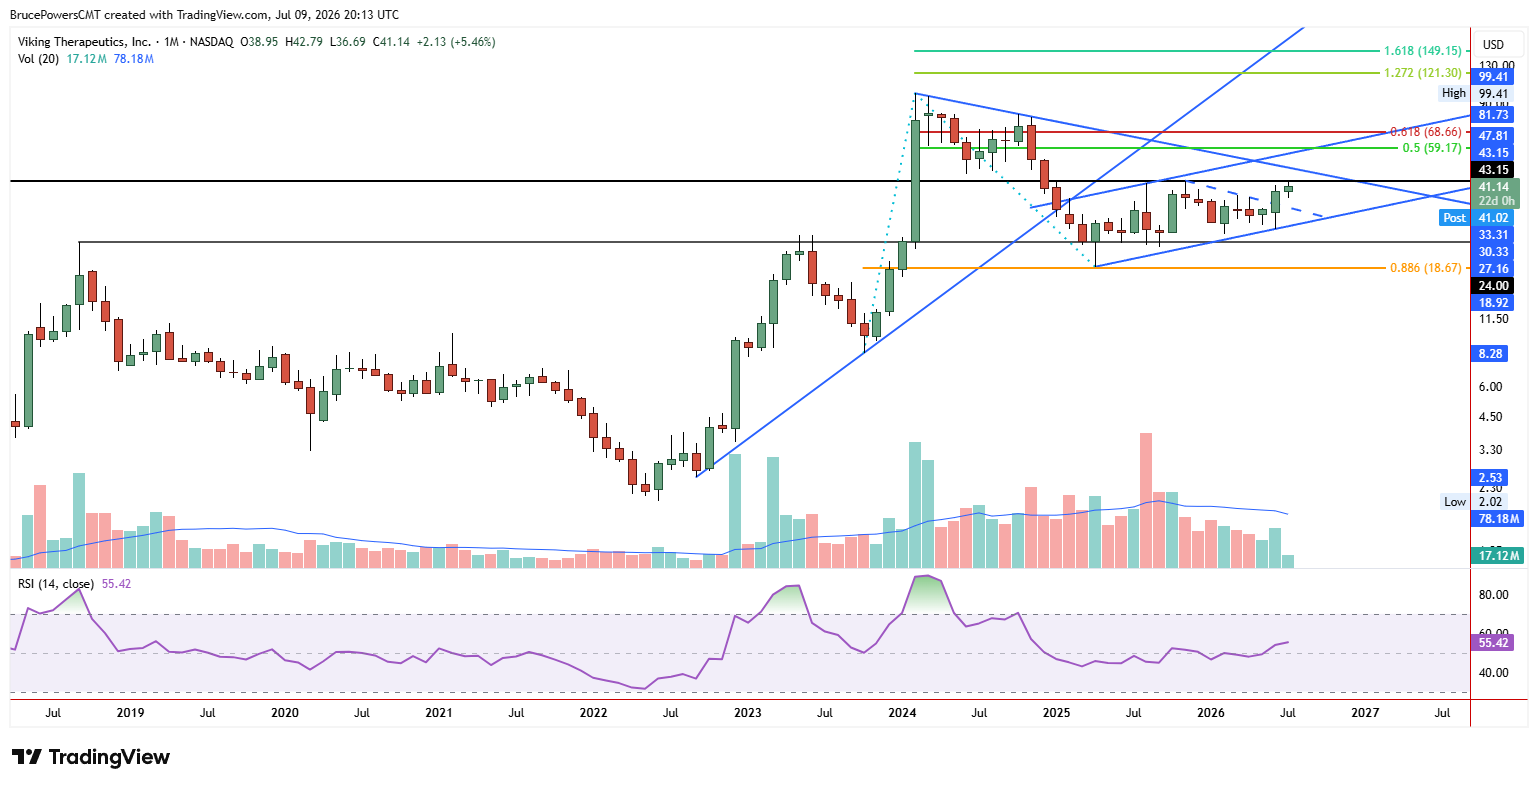
Key resistance for the bottoming formation is near the November 2025 spike high of $43.15. That high marked the upper boundary of an approximately 19-month consolidation range. The resistance zone has been tested several times since the peak of $99.41 in February 2024. Most recently, resistance was seen on Tuesday at a high of $42.79. However, the advance was accompanied by the highest volume in eight days, showing broadening participation as price approached this key resistance zone, a sign of strengthening demand.

Breakout Signals Gain Momentum Across Time Frames
Since the bottom of the bearish correction was established in early April 2025 at $18.92, completing an 88.6% Fibonacci retracement at $18.85 of the prior upswing, VKTX has traded within a range capped by the $43.15 high. The range further narrowed heading into May. Range compression was also reflected in the convergence of three major moving averages, including the 20-day, 50-day, and 200-day moving averages. Subsequently, several key upside breakouts were confirmed in June, including moves above a prior lower swing high and the 200-day moving average.
On a monthly basis, the breakout occurred above a six-month high of $39.99 on the strongest volume in four months, and VKTX finished June at its highest monthly closing price in 20 months. In recorded the highest monthly closing price of the entire consolidation phase. That is confirmation of strengthening on the higher time frame.
Healthy Pause Could Strengthen Breakout Potential
In the near-term, a pullback or consolidation before another breakout attempt would establish a more reliable launch pad for a significant breakout. As of Tuesday’s high, VKTX had advanced 57.6% from the most recent higher swing low of $27.16 set in June 11 over just 16 days. Moreover, previous measured moves within the consolidation formation indicate that the current advance may be due for a rest. Whether that pause comes first or buyers generate enough momentum for a near-term breakout above the long-term resistance zone will likely determine how the next phase of this developing bottom unfolds.
If you’d like to know more about technical analysis and how traders use it, please visit our educational area.