


Gold Attempts to Shift Corrective Momentum
Rather than continue to weaken and deepen a pullback, gold strengthened on Thursday, triggering a one-day bullish reversal to a high of $4,138. That was another successful test of resistance near the 20-day moving average, following Wednesday’s high, which also stopped near that indicator. The move suggests that the 20-day moving average may again be reclaimed as support.
Gold Price Forecast
Every new Gold analysis as it publishes, today's technical signal and key levels, live price — on one page.
See all Gold forecastsA higher daily high and higher low were established and a close for the session above $4,134 would confirm the reversal signal. At the time of writing, gold continues to trade near the highs and could be higher before the end of the session. A sustained close above nearby resistance would provide the first evidence that the recent corrective phase may be losing momentum.
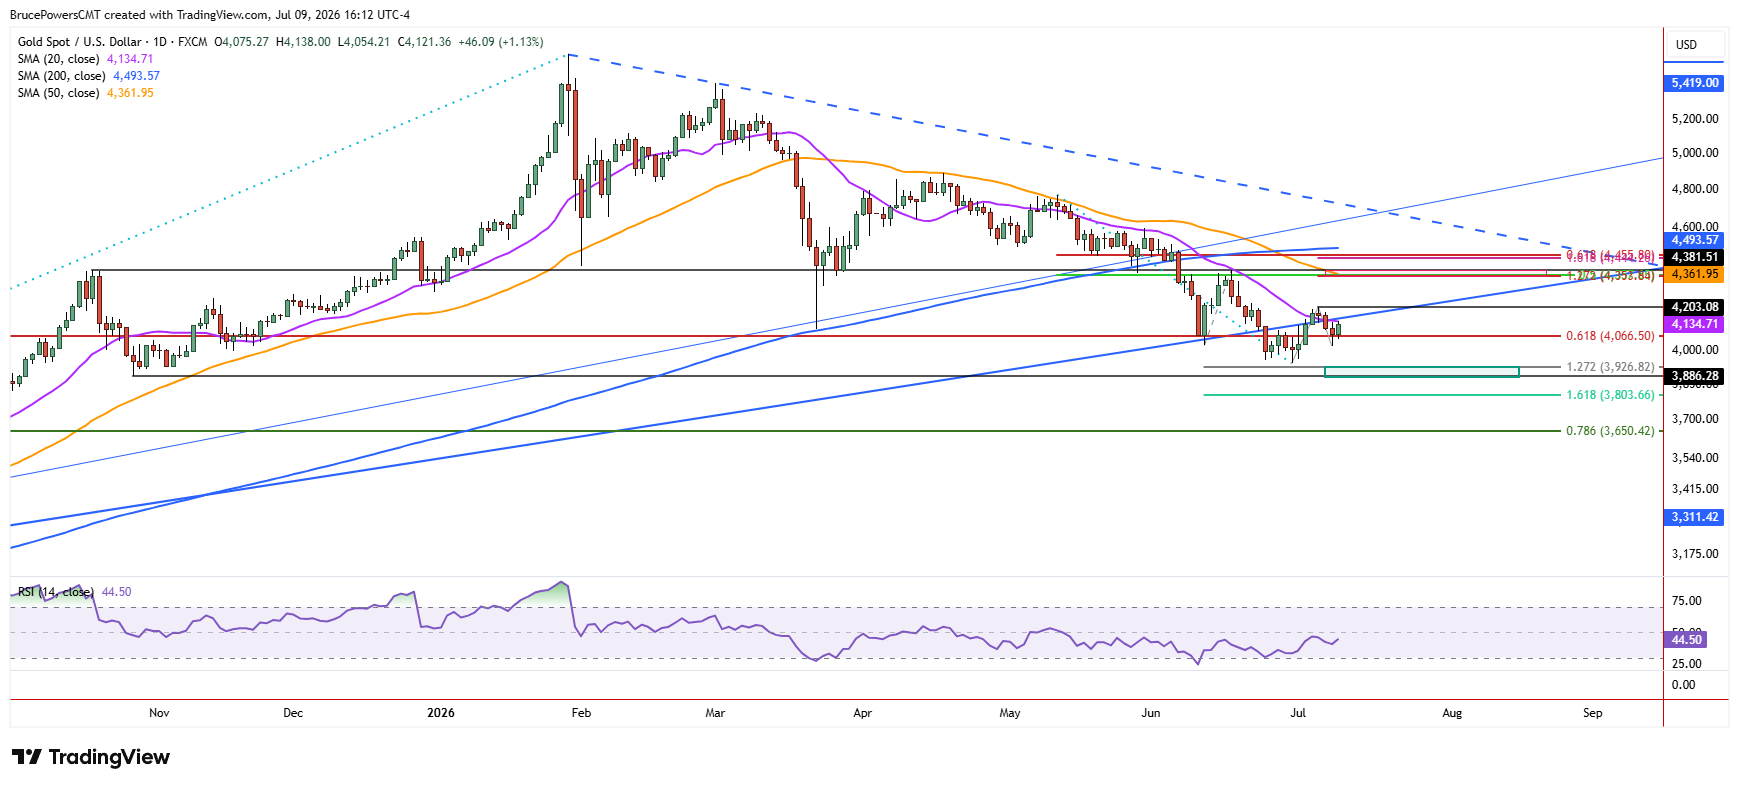
Although this bullish one-day price action requires further confirmation of strength, it suggests that Wednesday’s low of $4,021 could result in a higher swing low. That would occur with a session close above Wednesday’s high of $4,134. A higher swing low would be the first indication that the trend structure may be starting to change. Since the 20-day moving average has been tested over the past week, an advance above the recent lower swing high at $4,203 is needed before an upside continuation is clearly indicated. Nonetheless, a daily close above Wednesday’s high, particularly if it is decisively above it, would show bullish progress.

Resistance Levels Define the Next Breakout Test
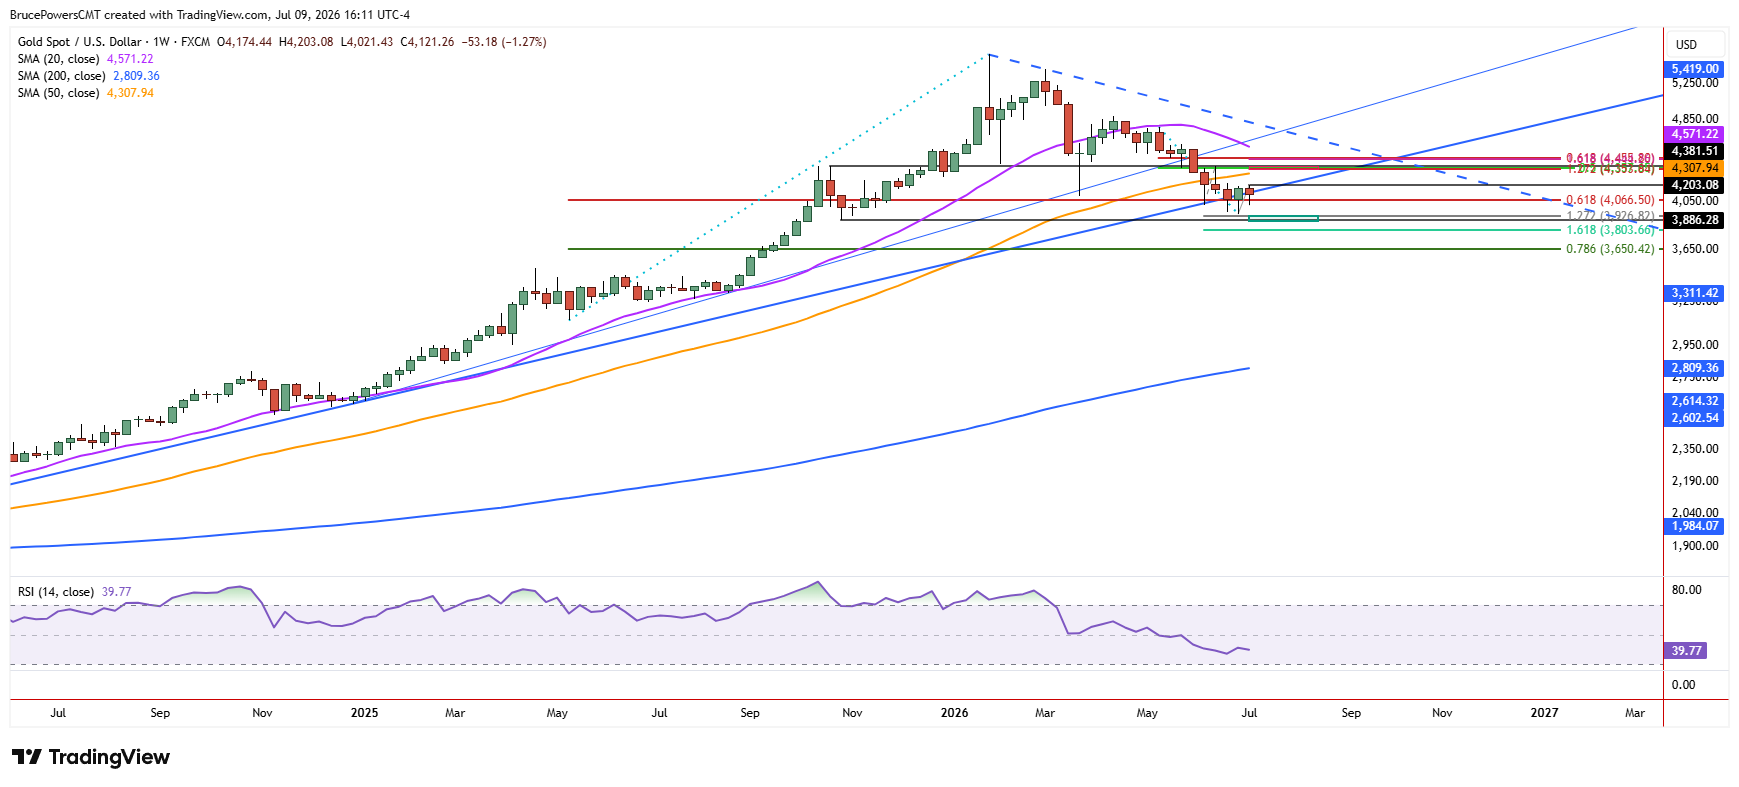
Another sign of strength would be indicated by a rise above Tuesday’s high of $4,181. That would put gold more clearly above both the 20-day average and the long-term trendline, which is currently positioned nearby. A close above Tuesday’s high would confirm strength by reclaiming both trend indicators. Next, a decisive breakout above $4,203 would be needed to trigger a bullish continuation, with the first primary target anchored by the falling 50-day moving average, currently at $4,362. Both the 50% retracement at $4,358 and the 127.2% Fibonacci projection for a small rising ABCD pattern near $4,354 provide additional confluence.
Bullish Setup Faces a Critical Support Test
Conversely, if dynamic trend resistance continues to hold, the recent bullish reversal attempt could fail. A drop below Thursday’s low of $4,054 and Wednesday’s low of $4,021 would weaken the developing higher swing low structure. That could lead to another test of support near the corrective low of $3,942 or a decline toward the next lower support target zone of $3,886. Therefore, the ability of gold to reclaim nearby resistance levels will likely determine whether the recent bounce evolves into a broader recovery or another leg lower within the correction.
If you’d like to know more about how to trade gold and silver, please visit our educational area.


