Recovery Reaches a Critical Breakout Zone
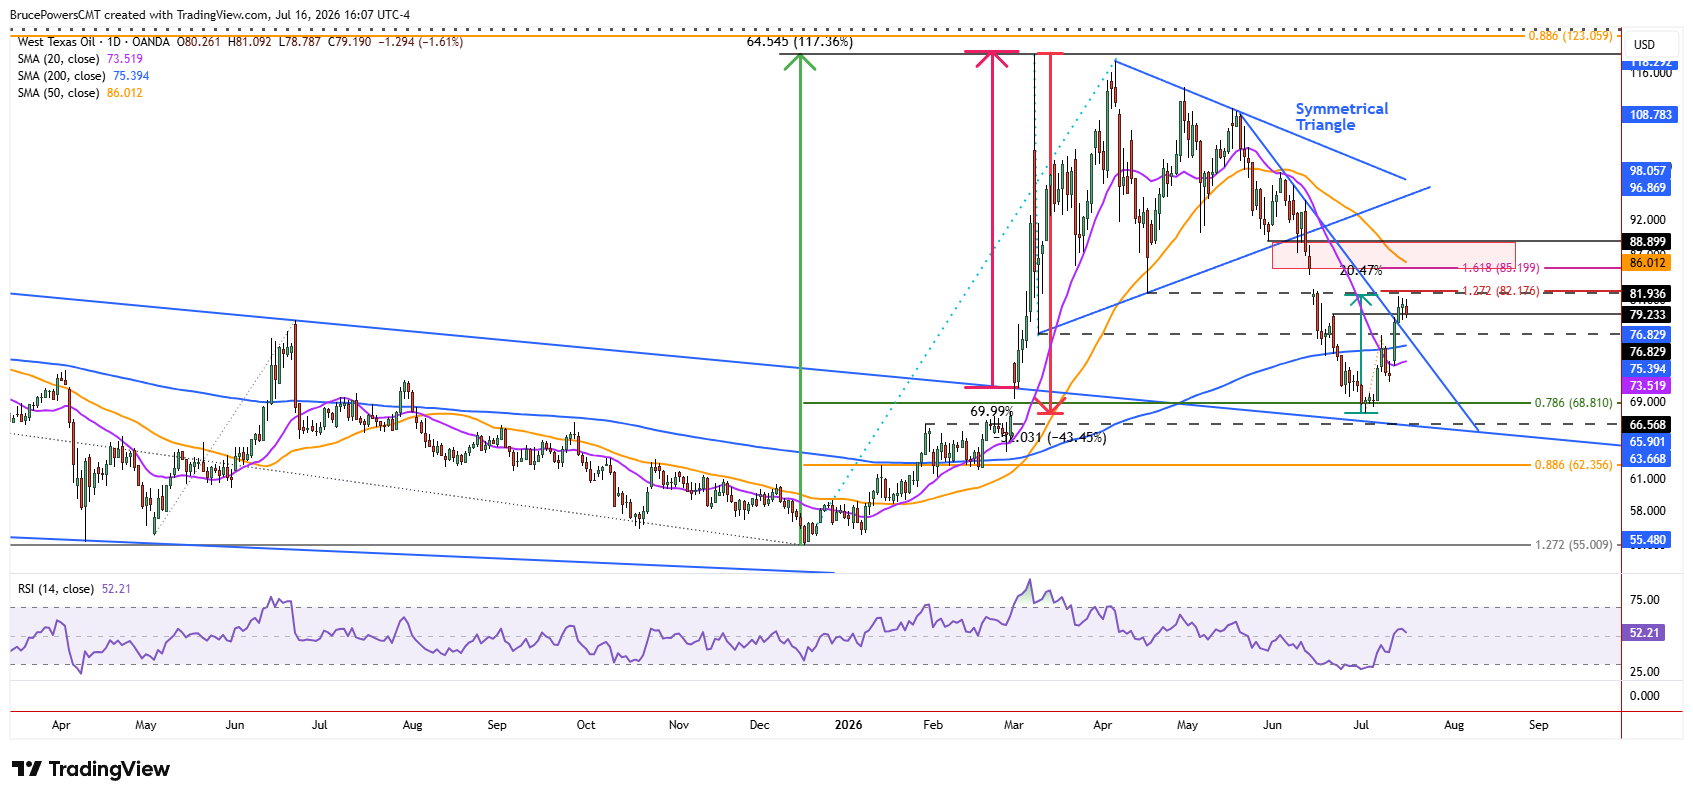
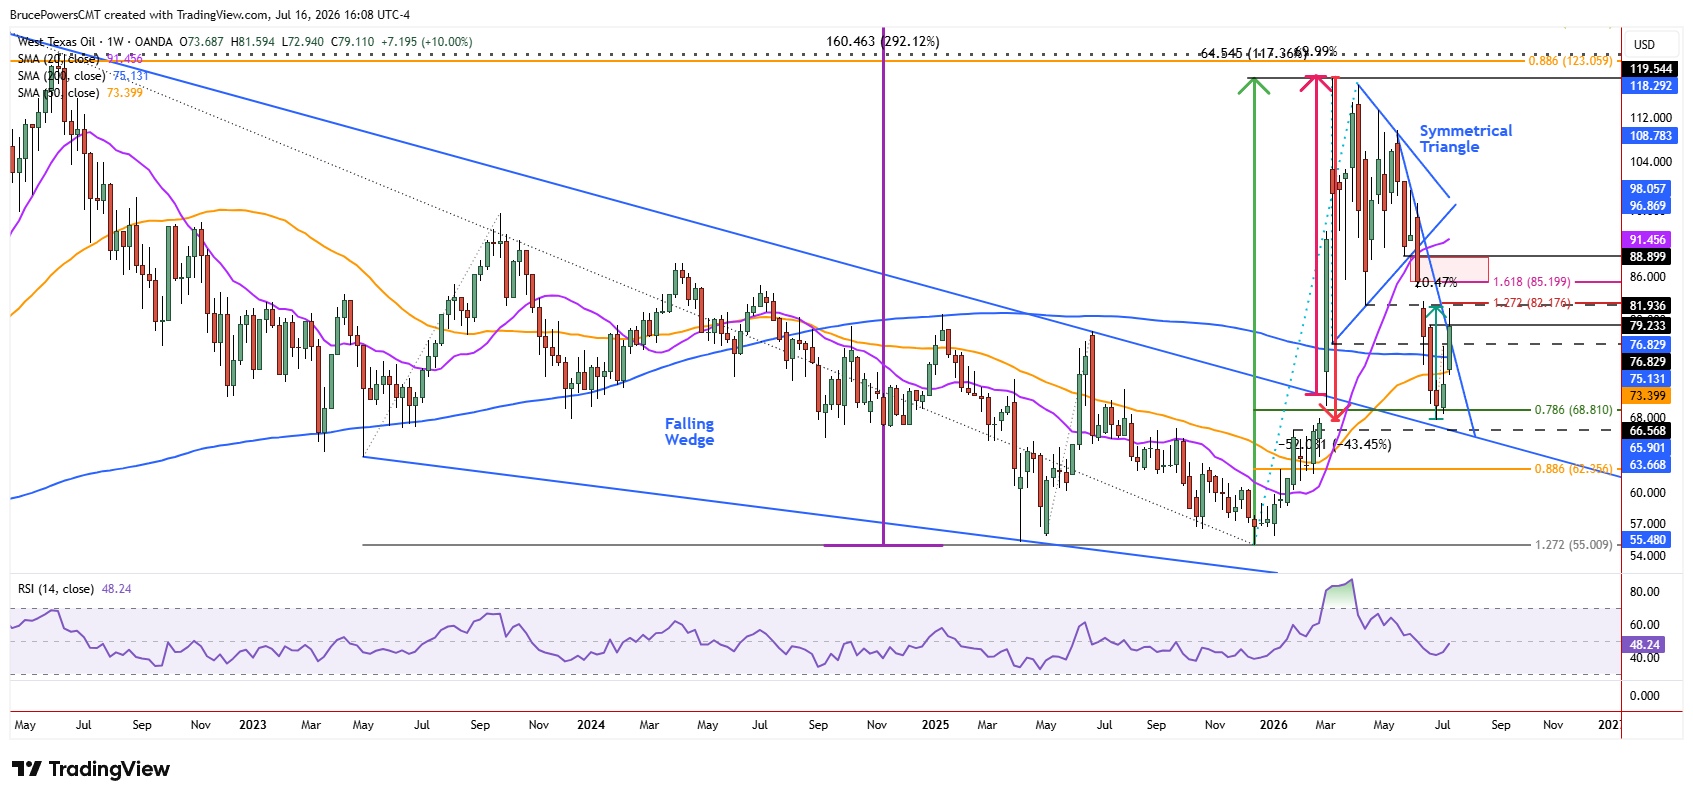
WTI crude oil stalled its advance at a high of $81.59 on Tuesday, as it completed a breakout above a downtrend line and a lower swing high from the prior decline. Resistance near the high is being tested near the confluence of a prior swing low from April at $81.94 and a 127.2% Fibonacci projection for a rising ABCD pattern, beginning from the recent low of $67.73.
On Thursday, trading remained inside Wednesday’s range, which was contained within the range from Tuesday. This pattern shows a small potential bullish pennant, which may be easier to visualize on an intraday chart. The consolidation is now creating a short-term decision point, with a breakout needed to confirm whether the recovery can continue.

Bullish Consolidation Forms Above New Support
The formation of the small pennant consolidation has confirmed support near prior resistance from the lower swing high at $79.23. That is short-term bullish behavior. Nonetheless, a decisive breakout signal above $81.59 is needed to show a continuation of the current advance. The price of crude oil had risen by as much as 20.5% from the recent low, as of Tuesday’s high. Therefore, some consolidation or a pause near current levels would not be unusual following such a strong advance.
Pullback Levels Offer Potential Buying Zones
Despite short-term signs of underlying strength, a pullback to test support near the downtrend line would also be normal behavior. Once support is found near that line, buyers may start to move in more aggressively. A couple of possible support levels can be observed along with the trendline. There is the recent higher swing low at $76.61 and the 200-day moving average near $75.39.
Since a reclaim of that average recently occurred, after crude oil traded below it for a relatively brief period, an eventual test of support near the 200-day moving average would be healthy for the potential bullish recovery now underway. Nonetheless, the next upside target for crude oil is near the 161.8% Fibonacci projection of the rising ABCD pattern at $85.20 and the falling 50-day moving average, which is currently near $86.01 but would likely be closer to the pattern target if reached later by price. A successful breakout above current resistance would keep the recovery intact, while a pullback that holds support would further validate the improving trend structure.
If you’d like to know more about how to trade crude oil, please visit our educational area.