Early Breakdown Shifts Focus to Critical Support
Following a short-term bounce in natural gas to a four-day high of $2.97 near the open of Thursday’s session, sellers quickly took control and drove prices sharply lower. Support near the recent low of $2.85 was broken, leading to a new low established at $2.83. Trading remains near the lows of the day at the time of writing, and a close below the prior low would confirm the breakdown and a continuation of the bearish trend. That weakness keeps the focus on whether support can stabilize prices or give way to the next leg lower.
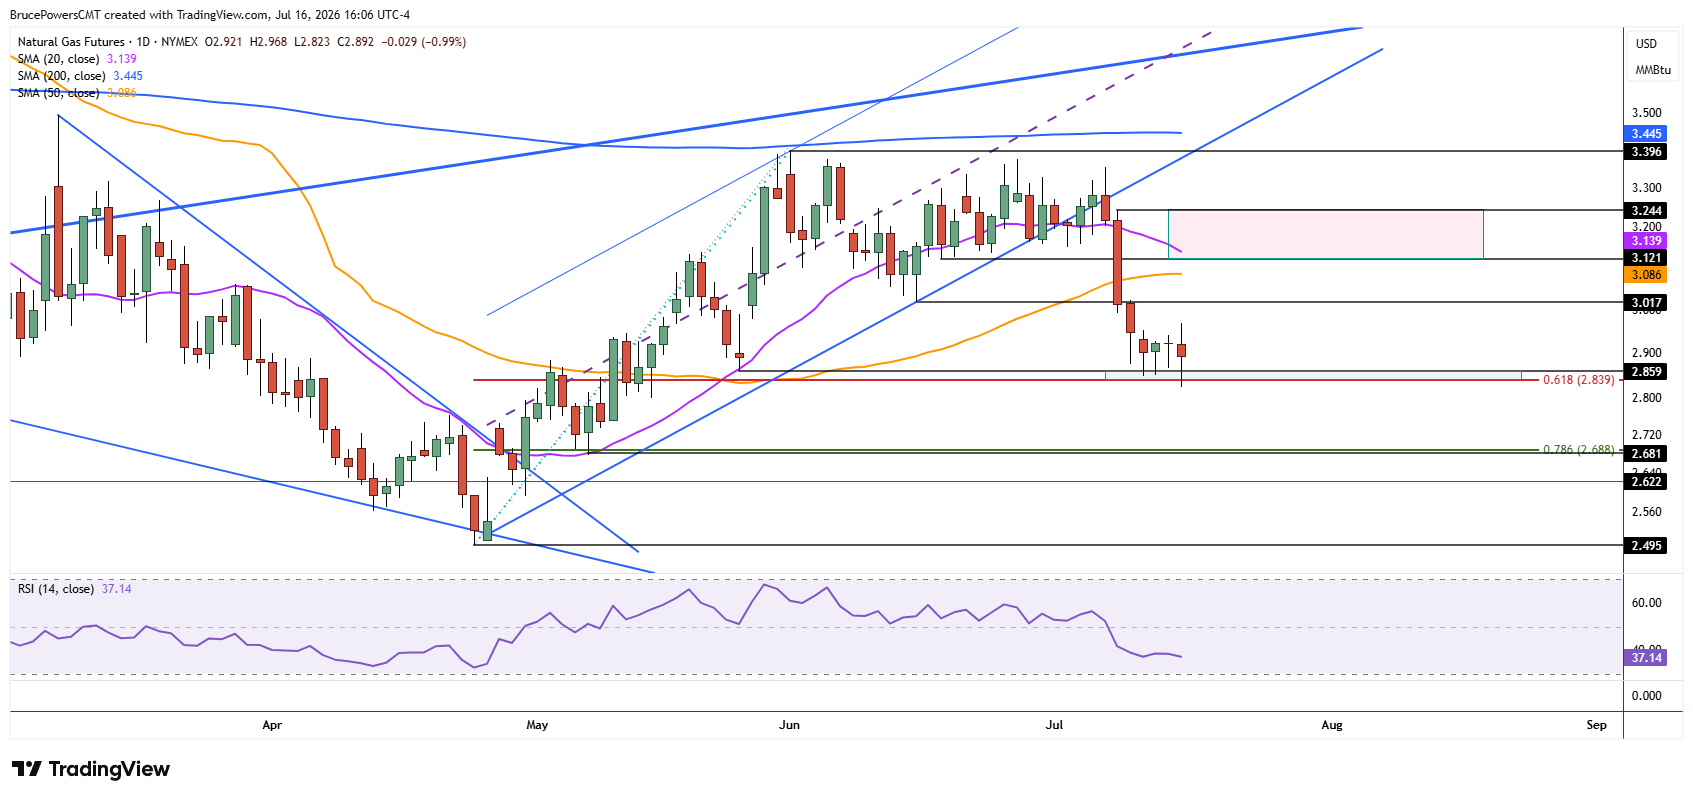
Although the current support zone has held so far, there are signs that it may eventually be broken decisively. A potential support range is identified from approximately $2.86 to $2.84, consisting of the higher swing low from May and the 61.8% Fibonacci retracement, respectively. This is an obvious location to watch for signs of strength and at least a bounce.

Bearish Signal Strengthens Below Recent Lows
Thursday’s price action formed a bearish outside day that engulfed the full range of the prior three days, making it a more significant bearish indication, especially if the session closes below Tuesday’s low of $2.85. Also, because a bearish trend reversal signal was briefly triggered on Monday’s drop below the higher swing low from May, a daily close below $2.86 will confirm that bearish signal.
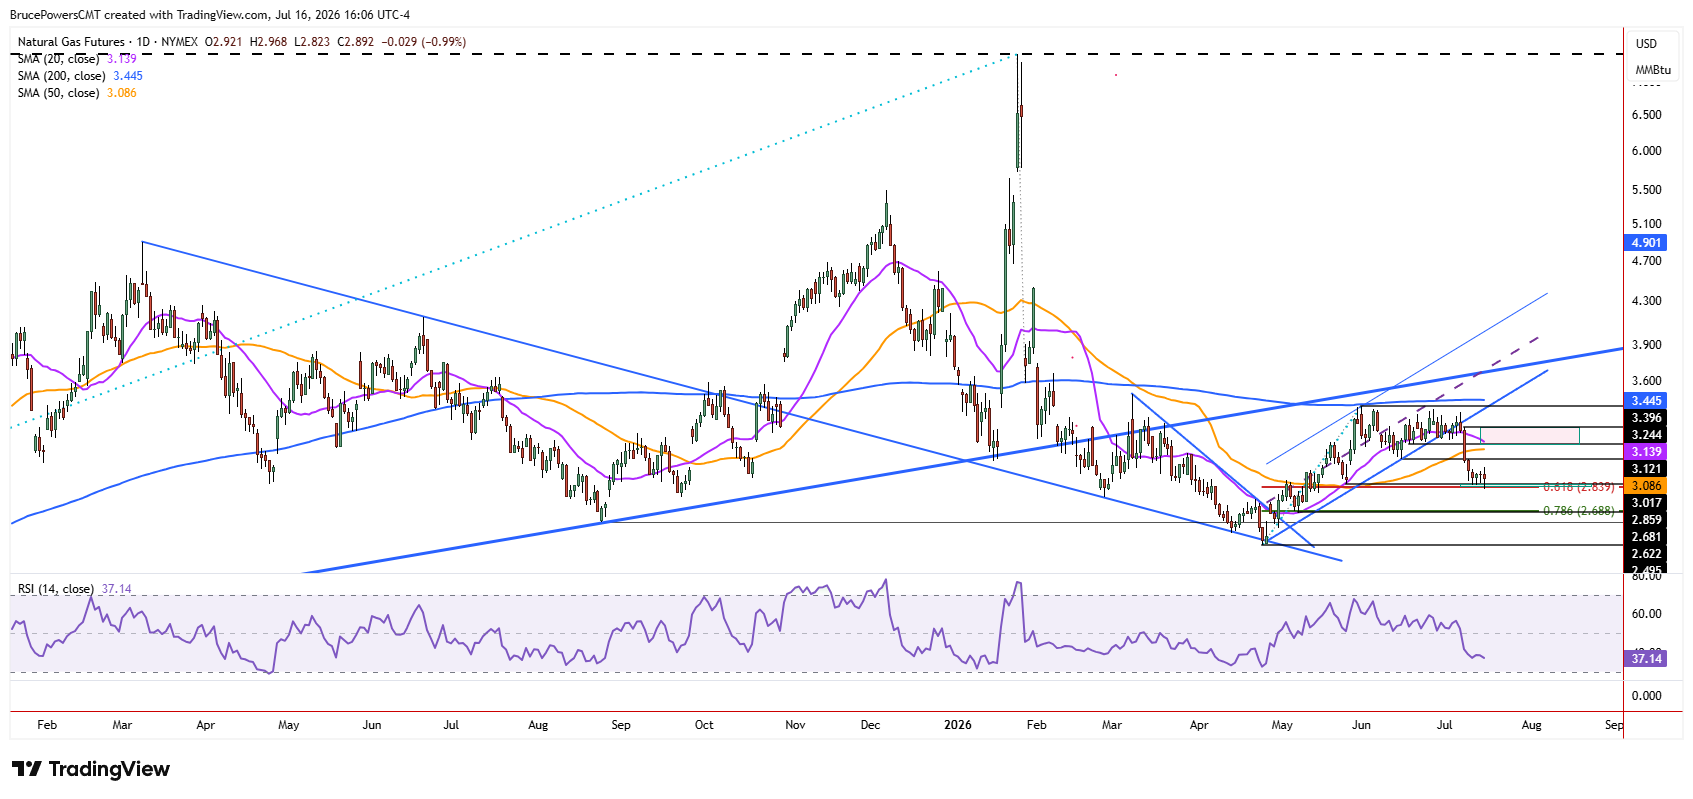
Nonetheless, a continuation of the decline will be signaled by a drop below Thursday’s low. That would put natural gas on track to reach the next lower target zone near the 78.6% Fibonacci retracement of the prior advance at $2.69. From there, a rebound or consolidation could develop, as the potential counter-trend rally would have more room to unfold after a deeper decline.
Recovery Faces Resistance
Otherwise, if signs of support continue near the current price zone, there remains a chance for an upside move towards the higher swing low at $3.02 and the 50-day moving average at approximately $3.09. The 50-day moving average appears to be the more useful trend indicator given the recent trend structure. It clearly failed as support last week as natural gas fell sharply. Therefore, there is a good chance it will act as dynamic resistance, at least during the first leg up of any recovery.
If you’d like to know more about how to trade natural gas, please visit our educational area.