Sellers Regain Control Below Moving Average Resistance
Gold declined to an 11-day low of $3,973 on Thursday, as sellers became more aggressive following a relatively slow move down after the lower swing high of $4,203 was established last week. The prior six days each found resistance at the 20-day moving average, with lower daily highs forming each day. On Thursday, there was a change in that pattern. For the first time in seven days, Thursday’s lower daily high of $4,065 did not reach the 20-day moving average.
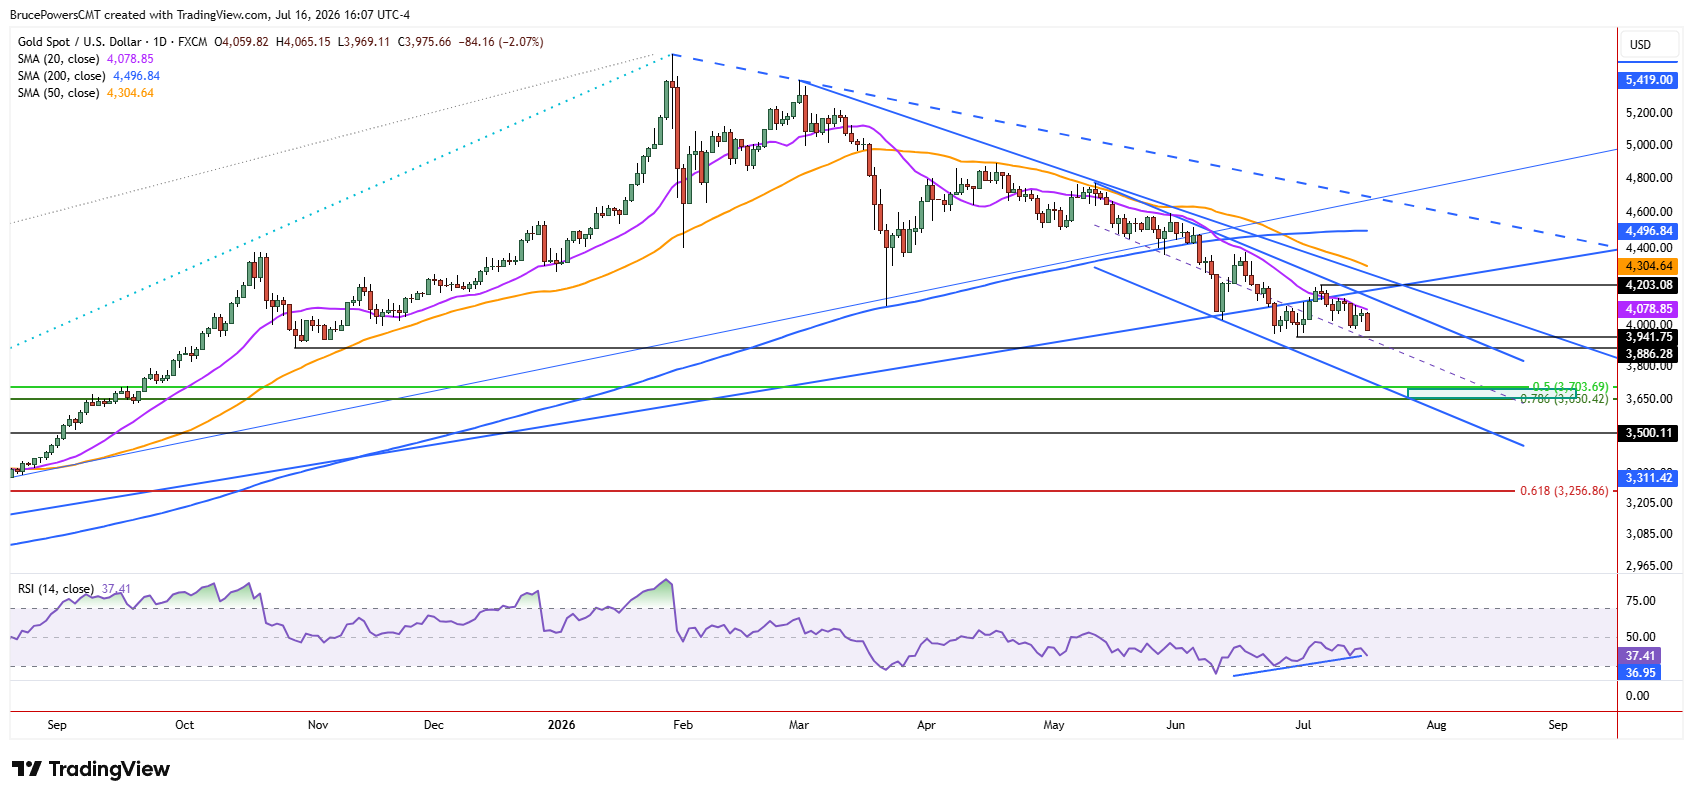
That, along with a likely weak close, either below Tuesday’s low of $3,983 or in the lower third of Thursday’s range, confirms that sellers are in control and becoming increasingly aggressive. In addition, gold is on track to end the session at its lowest daily closing price of the current short-term downswing. The increasing inability to challenge resistance reinforces the view that bearish momentum is continuing to build.

Next Support Zones Come into Focus
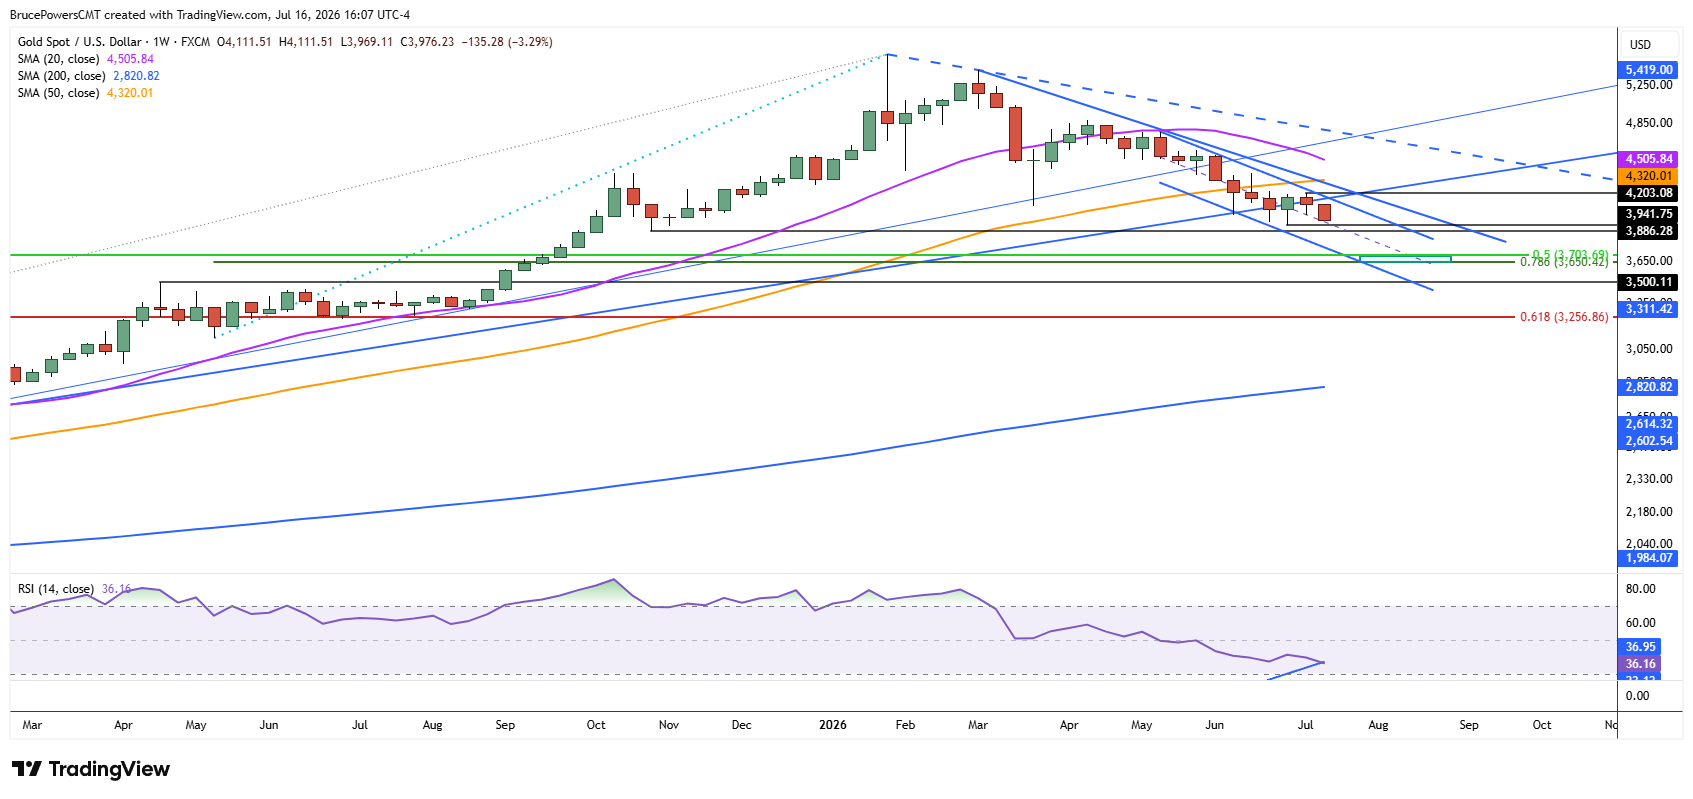
Now that gold has been rejected once again from resistance at the 20-day moving average, the developing bearish trend may be ready to proceed with its next leg lower. That would suggest that the prior trend low of $3,942 may be broken on the way to a test of support near the higher swing low of $3,886 from October 2025. There is also a reasonable chance that support may fail to hold near that low, which would provide another bearish reversal signal following the prior upswing.
A decisive decline below $3,886 would likely lead to the next lower target zone from approximately $3,704 to around $3,650, derived from the 50% retracement of a prior upswing and the 78.6% Fibonacci retracement of a smaller upswing that is contained within the larger trend structure. There may also be a test of the lower boundary of a falling trend channel near that price zone, depending on when it is reached. Signs of support may emerge near that lower boundary.
Longer-Term Trend Weakness Remains Intact
Gold has been progressively weakening overall since the January peak of $5,597. The deterioration in the technical picture began to have longer-term implications in early June when a confirmed breakdown below an uptrend line and the 200-day moving average occurred. Resistance during bounces shifted from the 50-day moving average to the 20-day moving average, reflecting increasing bearish momentum. Three weeks ago, a longer-term uptrend line defining dynamic support was broken to the downside and the area near the line has been confirmed as resistance. Taken together, short-term weakness is now aligned with longer-term weakness, suggesting further downside and reinforcing the bearish outlook.
If you’d like to know more about how to trade gold and silver, please visit our educational area.