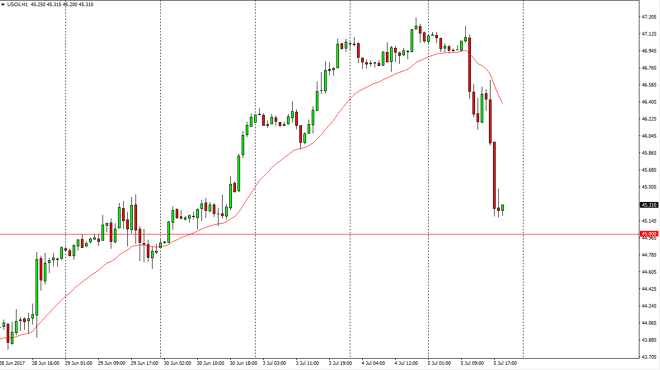
WTI Crude Oil The WTI Crude Oil market went sideways initially during the day on Wednesday, but then collapsed as the Russians said that they are not
The WTI Crude Oil market went sideways initially during the day on Wednesday, but then collapsed as the Russians said that they are not willing to cut production even further. Because of this, we have dropped all the way down towards the $45 level which of course has a certain amount of psychological support. If we break down below there, the market should go much lower. Any rally now continues to be and I selling opportunity as the oil markets are still going to deal with a significant amount of oversupply. The US dollar strengthening of course works against the value of oil as well, and I believe that we will then go down to the $42.50 level after that. I have no interest in buying the oil markets, as they fundamental simply do not line up for higher pricing.
Brent markets went sideways initially during the session as well, but also fell significantly. They also bounced enough to test the 24-hour exponential moving average, and then breakdown below there to test the $48 level. I believe that there is even more support at the $47 level under that, which has been important in the past. I believe that every time we rally, we should find exhaustion above, as the $50 level should essentially be the “ceiling” in the market. I have no interest in trying to bind this market, I believe that the oversupply issue continues to be a very big problem, and the US dollar rising will of course work against the value of Brent as well. We are awash in massive amounts of crude oil around the world and quite frankly cannot find enough places to store it. Selling is the only thing I will put money to.
Chris is a proprietary trader with more than 20 years of experience across various markets, including currencies, indices and commodities. As a senior analyst at FXEmpire since the website’s early days, he offers readers advanced market perspectives to navigate today’s financial landscape with confidence.