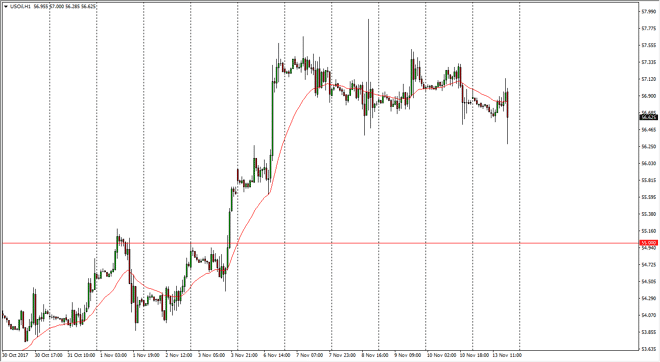
WTI Crude Oil The WTI Crude Oil market was very choppy during the trading session on Monday, as we continue to hang about. The $56.50 level looks to be
The WTI Crude Oil market was very choppy during the trading session on Monday, as we continue to hang about. The $56.50 level looks to be support, but it appears that we are trying to pull back, probably to pick up a little bit of momentum as we continue to try to reach towards the psychologically important $60 level. Remember, as price continues to go higher, it’s only a matter of time before the Americans, Canadians, and Mexicans start drilling even more. Because of this, I believe that the market will continue to be somewhat supportive, but it is a short-term phenomenon, especially if economic activity starts to slow down. The US dollar rallying could also be a bit of a boost as well, but we also have a lot of tension coming out of the Middle East, so that could continue to push the market back-and-forth.
Brent markets continue to find support at $63, and although we did breakdown below there, we found enough support cause a bit of a bounce. I believe that the market will probably continue to go towards the $64.50 level above. I think that as we continue to find volatility in this market, it’s only a matter of time before we rally towards the $65 level, which should be massively resistive. Alternately, if we break down below the $62.50 level, then I think the market will continue to drift lower, perhaps down to the $61.75 level. I expect to see quite a bit of volatility either way, as headlines will continue to push Brent and WTI around. Keep in mind that the US dollar moving can also have a negative correlation to this market as well. Expect choppiness, but I believe that the buyers are probably here, least in the midterm.
Chris is a proprietary trader with more than 20 years of experience across various markets, including currencies, indices and commodities. As a senior analyst at FXEmpire since the website’s early days, he offers readers advanced market perspectives to navigate today’s financial landscape with confidence.