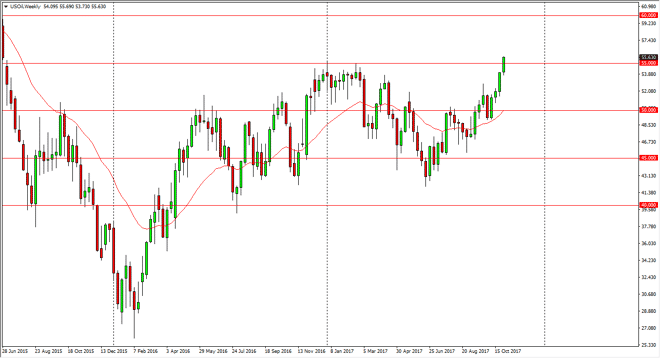
WTI Crude Oil The WTI Crude Oil market rallied significantly during the week, slicing through the $55 level. That is an area that is massively resistive,
The WTI Crude Oil market rallied significantly during the week, slicing through the $55 level. That is an area that is massively resistive, and that we have broken above that tells me that the buyers are coming back into the market. I think the $60 level above is the target, and I believe the pullbacks are going to be buying opportunities. Oil markets look very healthy, and we have broken above a major resistance barrier. If we break down below the $54 level, the market should roll over and go to the $50 level at that point. Given enough time, I believe that we will continue to see choppiness, but then given enough time I think that the oversupply of oil return. Obviously, we are not seeing that right now.
Brent markets initially fell during the week, but found enough support at the $60 handle to turn around and rally. We are closing at the week at the top of the range, so that is a very bullish sign, and I think that we will continue to see upward pressure, perhaps reaching toward $65 next. If we were to break below the $60 level again, that would be negative and send this market looking for $58 level below. However, I think that more than likely we will continue to see the strength in general, so I like buying dips and recognize that $65 is the next large, round, psychologically significant number.
The fact that the oil markets can rally in the face of the stronger US dollar is also a sign of just how bullish things have gotten. However, I do recognize that eventually the Americans flood the market with supply, even though we are starting to see tightening of the supply chain worldwide.
Chris is a proprietary trader with more than 20 years of experience across various markets, including currencies, indices and commodities. As a senior analyst at FXEmpire since the website’s early days, he offers readers advanced market perspectives to navigate today’s financial landscape with confidence.