WTI Crude Oil The WTI Crude Oil market initially went sideways during the trading session on Friday, but then pulled back to form a bit of a hammer. We
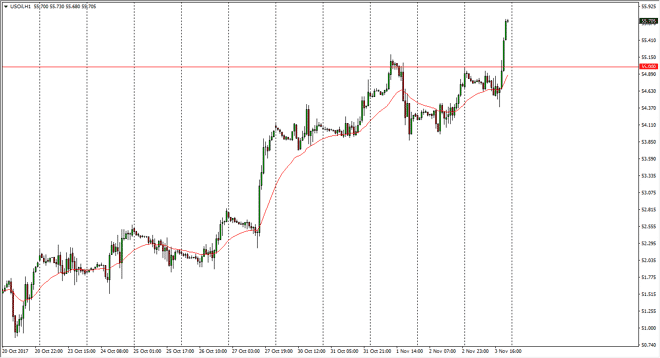
The WTI Crude Oil market initially went sideways during the trading session on Friday, but then pulled back to form a bit of a hammer. We broke above the top of that hammer on the hourly chart, then sliced through the $55 level. By closing above there at the end of the week, it shows just how bullish the market has gotten, especially the hedge funds that I talk to. I think that we do continue to see moves to the upside, perhaps reaching towards the $60 level. I think that if we can stay above the $54 level, it’s a “buy on the dips” short-term market. I think that given enough time, the market will find plenty of supply above that will eventually turn the market back around. I think that the market will continue to be one that will be volatile, but right now looks likely that the upside wins out.
The Brent market also rally, after initially going sideways as the 24-hour exponential moving average has turned decidedly positive. I think the $62 level above should offer a potential pullback, and that pullback should be a nice buying opportunity as the market will more than likely go looking towards the $65 level. I believe that the $60 level underneath is massively supportive, and essentially a “floor” in the market. If we were to break down below the floor, we could go much lower, perhaps reaching towards the $57.50 level.
In general, I think Brent is going to be positive for several days, even with the US dollar strengthening. That’s impressive, it tells me that you do not want to try to fight the uptrend. Longer-term, the sellers will come back, but we are obviously not seeing that currently.
Chris is a proprietary trader with more than 20 years of experience across various markets, including currencies, indices and commodities. As a senior analyst at FXEmpire since the website’s early days, he offers readers advanced market perspectives to navigate today’s financial landscape with confidence.