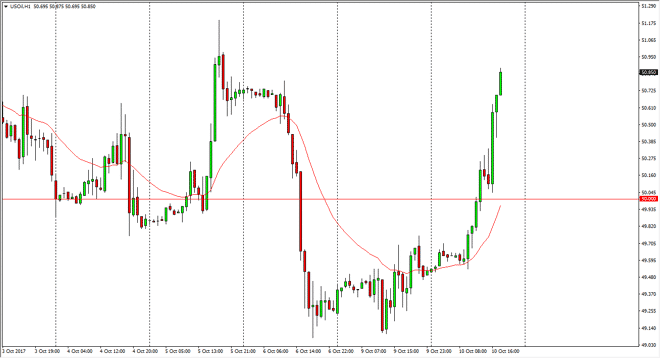
WTI Crude Oil The WTI Crude Oil market exploded to the upside during the trading session on Tuesday, slicing through the $50 handle. We broke above there,
The WTI Crude Oil market exploded to the upside during the trading session on Tuesday, slicing through the $50 handle. We broke above there, reaching towards the $51 level, and although we are a bit overbought, I think that the bullish pressure is going to continue to send this market to the upside. If we pull back from here, I suspect that we would continue to be in consolidation, reaching down towards the $49 handle for support. Ultimately, this market will continue to be very noisy, but if we break below the $49 level, the market will collapse and reach towards the $46 handle. Alternately, if we break above the $51 level, the market should then go to the $52.50 level above.
Brent markets have shown bullish pressure over the last 48 hours, and therefore it looks as if we’re going to reach towards the $57 level above which is a resistant. Nonetheless, I think that the market continues to be very noisy over here as well, but given enough time the market will have to make a longer-term move. I think that there is a lot of support below at the $55 level, and if we can break down below there, the market could go to the $52.50 level underneath. Ultimately, if we break out above the $57.25 level, the market could go to the $60 level after that. The market should continue to see a significant back and forth action, so I would be very careful and keep my trading positions very small. Ultimately, this is a market that is somewhat range bound, although we have seen a lot of bullish pressure, we could just as easily see a lot of bearish pressure tomorrow. The market still looks very erratic to say the least.
Chris is a proprietary trader with more than 20 years of experience across various markets, including currencies, indices and commodities. As a senior analyst at FXEmpire since the website’s early days, he offers readers advanced market perspectives to navigate today’s financial landscape with confidence.