
Advertisement
Advertisement
Crude Oil Price Forecast October 12, 2017, Technical Analysis
Updated: Oct 12, 2017, 04:55 GMT+00:00
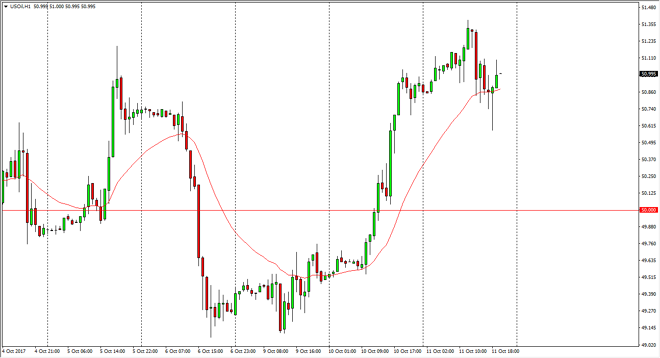
WTI Crude Oil The WTI Crude Oil market initially rallied on Wednesday, but turned around at the $51.35 level, and then pulled back towards the $50.75
WTI Crude Oil
The WTI Crude Oil market initially rallied on Wednesday, but turned around at the $51.35 level, and then pulled back towards the $50.75 level. The codes of this, we turned around to show signs of strength again, and I think that it’s only a matter of time before the buyers get involved and try to push this market towards the $52.50 level. I believe that there is significant support down to the $50 level underneath, which of course is a large, round, psychologically significant number. We continue to see a lot of volatility in this market, and I believe that should continue to be the case as the Saudi Arabians and Russians are now talking about cutting back production.
Crude Oil Price Forecast Video 12.10.17
Brent
Brent markets have seen buyers come back later in the day, and it looks as if we’re going to try to reach towards the $57 level yet again. This is a market that continues to be volatile, and I think that eventually we can break above the $57.25 level and go looking towards the $60 level. I also recognize that there’s a lot of support below, and that this market will continue to chop around not only in reaction to the increased production cuts, but also what happens with the US dollar after the FOMC Meeting Minutes. Quite frankly, I think that there is more bullish pressure than bearish, least in the short term. However, I recognize that at the first signs of exhaustion, we could have sellers jumping back into the market. This is a market that I think is much more volatile than worth bothering with, at least for a larger position is concerned. Ultimately, I believe small positions will be needed to navigate these very choppy and dangerous markets.
About the Author
Christopher Lewisauthor
Chris is a proprietary trader with more than 20 years of experience across various markets, including currencies, indices and commodities. As a senior analyst at FXEmpire since the website’s early days, he offers readers advanced market perspectives to navigate today’s financial landscape with confidence.


Advertisement