Advertisement
Advertisement
Crude Oil Price Forecast October 13, 2017, Technical Analysis
Updated: Oct 13, 2017, 05:42 GMT+00:00
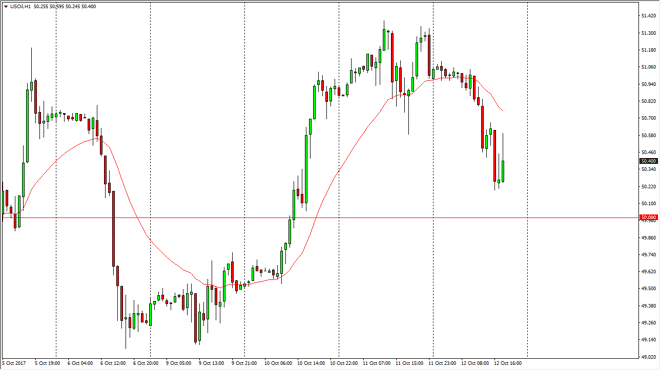
WTI Crude Oil The WTI Crude Oil market went sideways initially during the day on Thursday, but then rolled over yet again. This is a market that continues
WTI Crude Oil
The WTI Crude Oil market went sideways initially during the day on Thursday, but then rolled over yet again. This is a market that continues to struggle in general, that I see the $50 level underneath being a support level that should continue to attract a lot of attention. I believe that the $50 level underneath should continue to be important for the market, as it is a large, round, psychologically significant number. In the meantime, I think we are somewhat range bound, and it’s likely that we will continue to bang around sideways. I think that there will be buyers closer to the $50 level, just as there will be sellers closer to the $51.50 level. If we were to finally break down below the $49 handle, the market should break down significantly as it would show that the market is ready to roll over completely. Alternately, if we break above the $51.50 level, the market will probably go looking towards the $53 level next.
Crude Oil Forecast Video 13.10.17
Brent
Brent markets also rolled over during the Thursday session, initially going sideways but then reaching towards the $56 handle. A breakdown below there should send this market looking towards the $55 level which is much more psychologically important. I think there are plenty of buyers in this area, and therefore think it’s likely that we will continue the overall consolidation. If we were to break above the $57 level, then the market should then go to the $60 handle above which should be resistant. However, I think that the noise in the oil markets will not only be an issue, but a major concern. I think this is a range bound market at best, and what you are looking to do is sell the market when is overbought, and by the market once it is oversold. Expect a lot of noise.
About the Author
Christopher Lewisauthor
Chris is a proprietary trader with more than 20 years of experience across various markets, including currencies, indices and commodities. As a senior analyst at FXEmpire since the website’s early days, he offers readers advanced market perspectives to navigate today’s financial landscape with confidence.
Advertisement
