Advertisement
Advertisement
Crude Oil Price Forecast October 18, 2017, Technical Analysis
Updated: Oct 18, 2017, 04:56 GMT+00:00
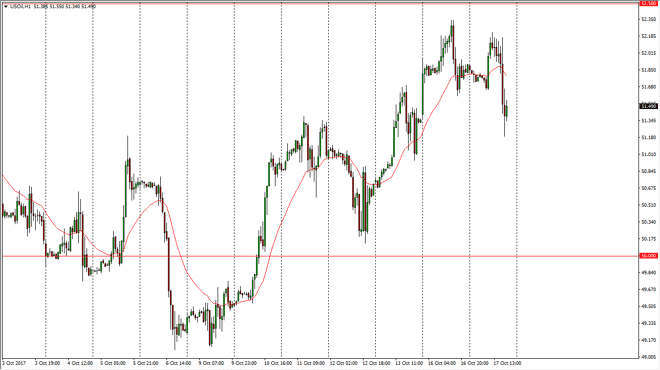
WTI Crude Oil The WTI Crude Oil market initially tried to rally during the day on Tuesday, but found enough resistance near the $52.20 level to roll over
WTI Crude Oil
The WTI Crude Oil market initially tried to rally during the day on Tuesday, but found enough resistance near the $52.20 level to roll over again. By doing so, we tested the $51.50 level underneath. I think the market may rollover a bit from here, because quite frankly we made a “lower high.” Oil markets continue to be difficult to deal with as there is a significant amount of noise. After all, the markets continue to deal with headlines that push and pull pricing. Ultimately, I believe that the markets will roll over due to the lack of violence after the invasion of Kurdistan by Iraqi military. Because of this, the markets will come down, and I believe we will go looking towards the $50 level again. The $52.50 level above continues to offer a significant amount of resistance as well.
Oil Forecast Video 18.10.17
Brent
Brent markets also fell after initially trying to rally, but they have a gap that has been holding them up. If we can break down below the $57 level, Brent markets could drop rather significantly. Ultimately though, we’ve made a “lower high” over here as well, and I think that we will roll over and go towards the $56.50 level below, and then possibly the $55 level after that. This is a market that remains very noisy, and quite frankly more susceptible to the noise coming out of Kurdistan as it is the international benchmark for crude oil.
Any rally at this point should continue to see sellers above, and I believe that even if we do rally to the upside, the $60 level above is the absolute ceiling in the market from what I can see. It’s not to be easy, but I remain a bit skeptical of any rally that we see in the markets.
About the Author
Christopher Lewisauthor
Chris is a proprietary trader with more than 20 years of experience across various markets, including currencies, indices and commodities. As a senior analyst at FXEmpire since the website’s early days, he offers readers advanced market perspectives to navigate today’s financial landscape with confidence.
Advertisement
