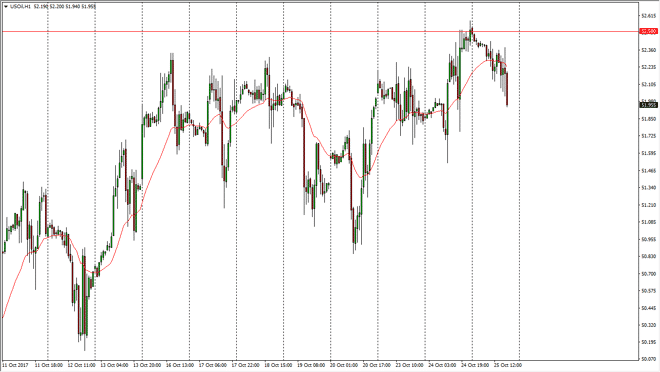
WTI Crude Oil The WTI Crude Oil market broke down significantly during the day on Wednesday, testing the $52.50 level IV resistance, and then rolling
The WTI Crude Oil market broke down significantly during the day on Wednesday, testing the $52.50 level IV resistance, and then rolling over. This is also in reaction to a larger than anticipated inventory build, as it shows we continue to struggle to burn off the massive oversupply of crude. I think if we can break down below the $51.50 level, the market could drop significantly. Alternately, if we get some type of supportive candle, we may try to reach towards the $52.50 level above again, and a break above there would be very bullish. Overall, I think the one thing that probably is almost guaranteed is going to be choppiness and volatility, as we have seen for quite a while now. I think a break above the 52.50 region allows the market to free itself towards the $55 level above. Until then, I think that the market is probably best traded from the short-term only.
Brent markets were a little bit more destructive in their movement during the day on Wednesday, as the $58.50 level offered enough resistance to initially form a hammer, and then a breakdown. I think were to go looking towards the $57.25 level, with the occasional rally. If we can break down below there, then the market becomes much more bearish, but in the meantime, I think it’s likely that we will see more choppiness than anything else. I think that the $58.50 level will continue to be massive trouble for the buyers, and therefore we might be towards the top of the overall consolidation area. Small position sizes will probably be the best way to go. Ultimately, OPEC headlines of course are starting to cause issues in the markets as well, so be cautious and perhaps you CFD markets instead of futures markets.
Chris is a proprietary trader with more than 20 years of experience across various markets, including currencies, indices and commodities. As a senior analyst at FXEmpire since the website’s early days, he offers readers advanced market perspectives to navigate today’s financial landscape with confidence.