


Double Bottom Formation and Structural Support
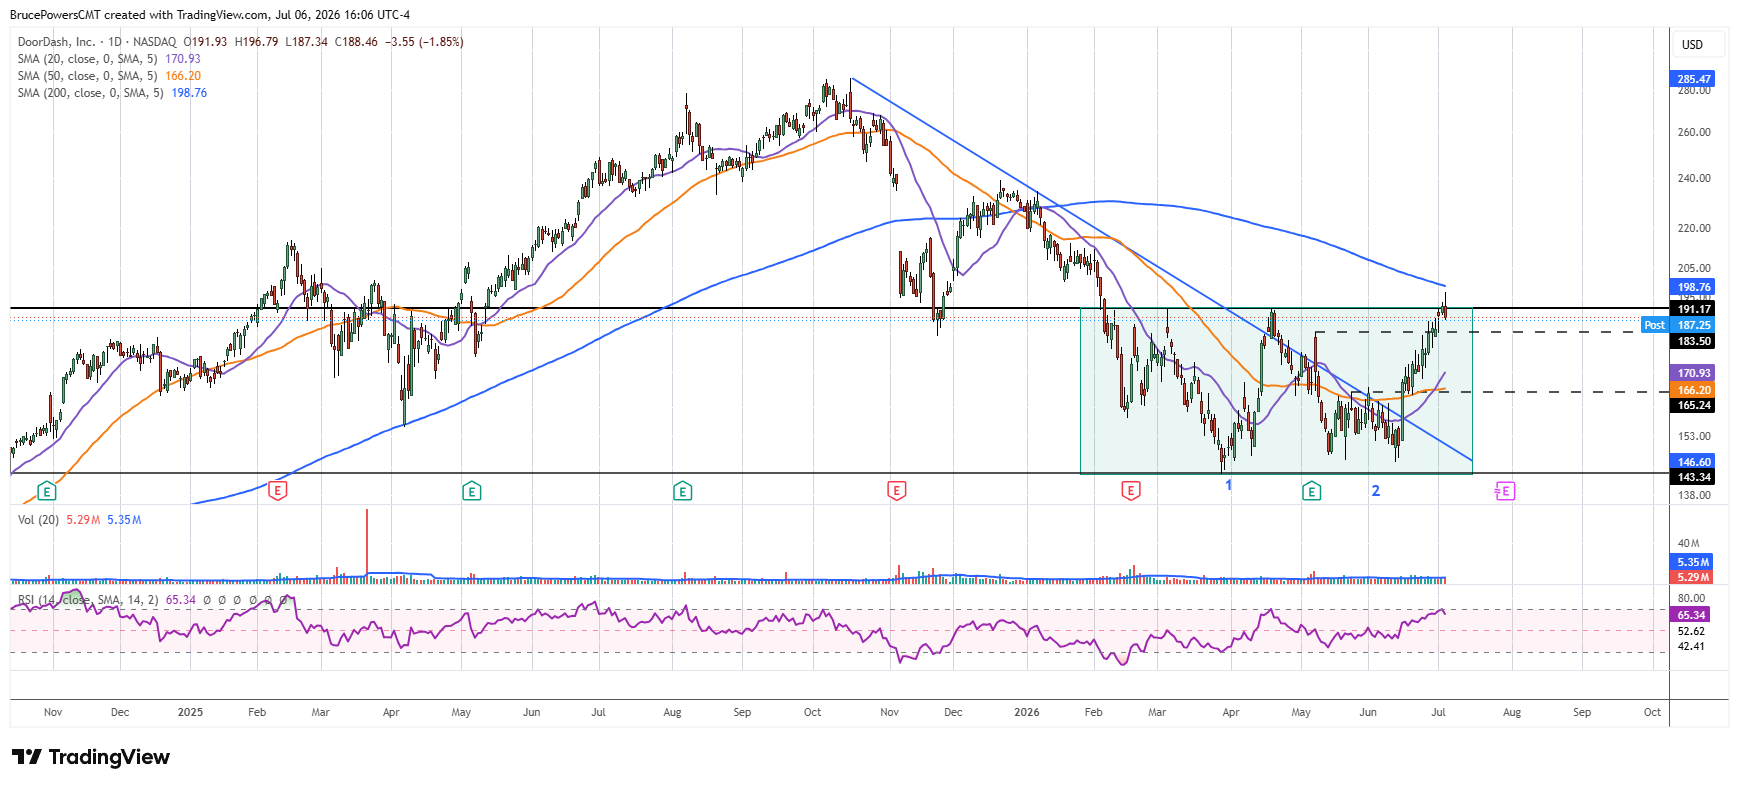
DoorDash, Inc. (DASH) stock has established a double bottom type consolidation pattern. It found support and established a low for the bearish correction at $142.30 in March. That was a successful test of support near prior resistance seen near the March 2024 highs. An initial rally off that low established a lower swing high at $191.17, as a prior structure support zone was tested as resistance. Another decline followed that high before an eventual slightly higher swing low of $146.11 was formed in mid- June.

Breakout Attempt Above Neckline Resistance
A rally followed that second low, triggering a breakout above the lower swing high and neckline of the double bottom pattern at $191.17 on Friday, reaching a 21-week high of $193.44. On Monday, the advance extended to a high of $196.79, before pulling back intraday. Since bullish momentum began near the recent low, the fact that it diminished near a key potential resistance zone is not a surprise. However, the rally that preceded it does suggest that DASH is trying to break out of its bottoming formation.
200-Day Moving Average as Key Pivot Zone
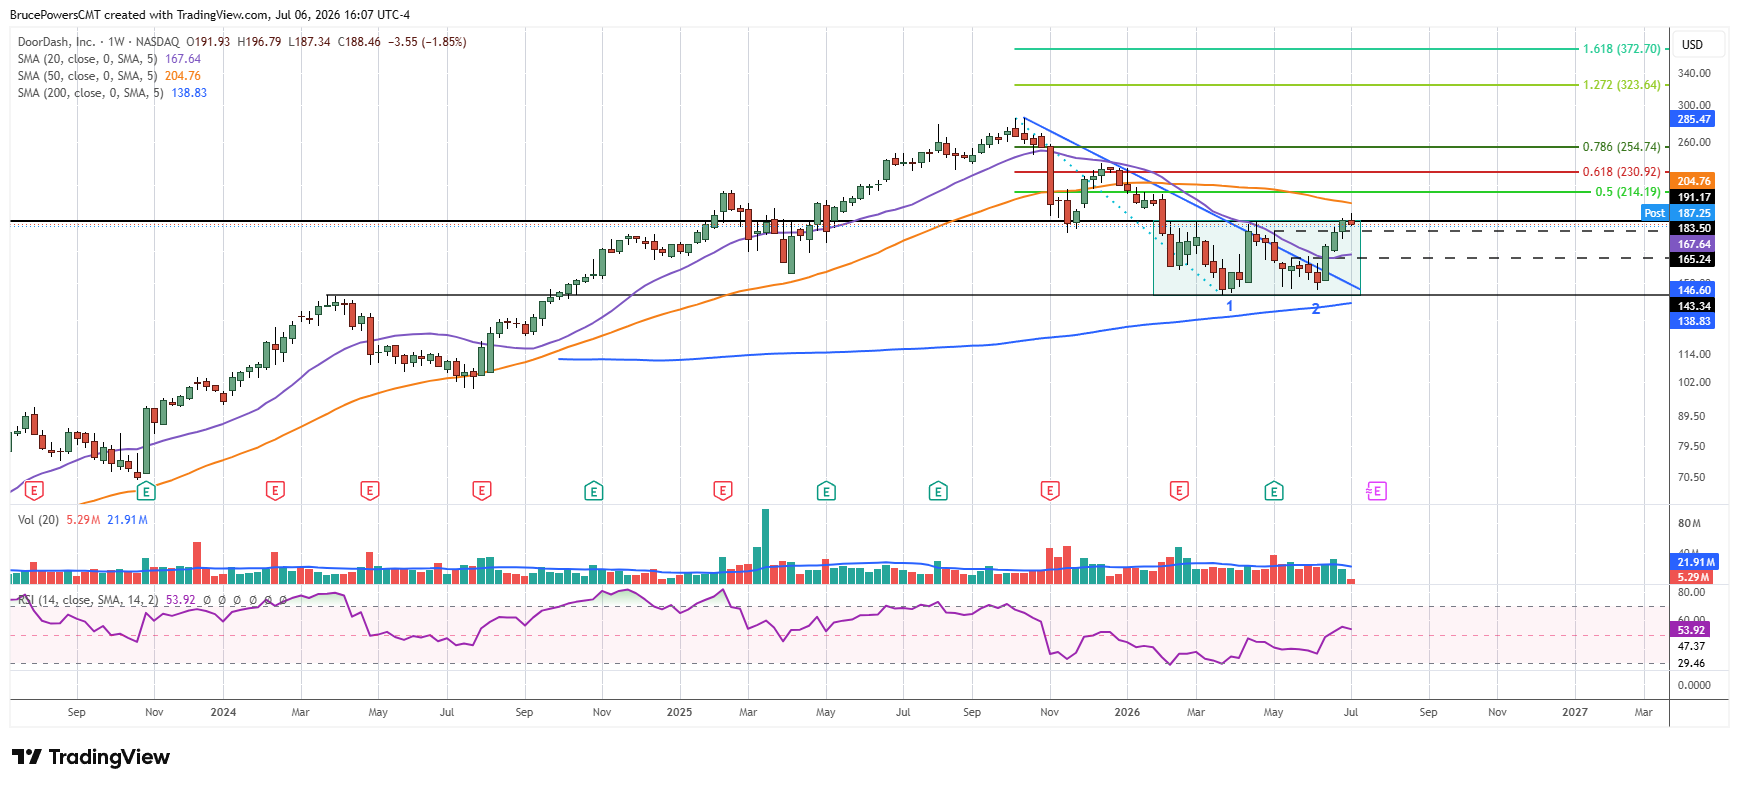
In addition to resistance near the lower swing high of $191.17, dynamic resistance is also nearby and represented by the 200-day moving average, currently near $198.76 and falling. This means that by the time resistance is again tested, the 200-day average will be more closely aligned with the April high. That will add to its significance as a pivot zone. Therefore, an upside breakout would need to exceed the swing high and the 200-day moving average to be successful.
Support Levels to Watch on Pullbacks
Given the potential for an upside breakout and reclaim of the 200-day moving average, traders will be watching for pullbacks as potential opportunities to identify new signs of strength. Potential support from trend structure is indicated near $183.50 and $165.24. The 50-day moving average near $166.21 is key dynamic support and aligns near the lower structure area. There is also the 20-day moving average at $170.92 and rising, where there could be signs of support. Since the 20-day moving average was reclaimed during the current advance, an eventual test of the indicator as support is likely to occur at some point.
If you’d like to know more about technical analysis and how traders use it, please visit our educational area.


