Trend Support Holds as Price Tests Strength
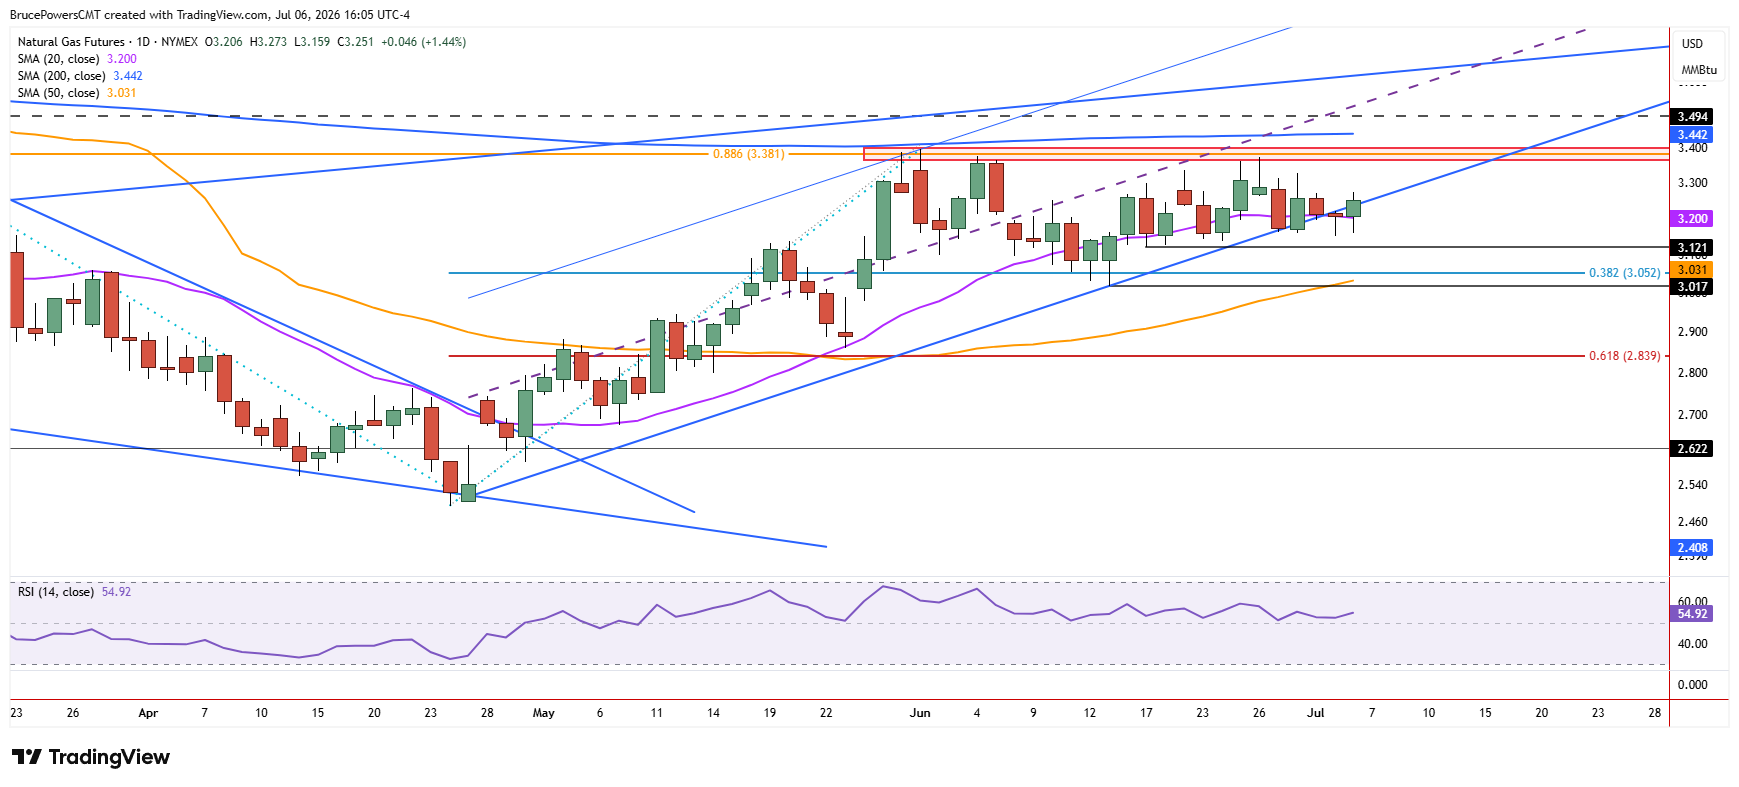
Natural gas continued to test dynamic trend support on Monday, establishing a higher daily high and higher low, at $3.27 and $3.16, respectively. Short-term strength was retained by a daily closing above the uptrend line and 20-day moving average, now near $3.20. This was a minor sign of strength, though it needs further bullish evidence before another test of the recent resistance zone might occur. That zone was established from a recent lower swing high at $3.38 to the June trend high of $3.40.

Consolidation Structure Remains Intact
Despite the nearby trend indicators, consolidation is the current state of the market for natural gas. The high of the consolidation range is defined by the trend high, while the low for the range depends on how it is measured. A short-term sideways range shows potential support near a minor interim swing low of $3.12 from June 17. But that smaller consolidation range is contained within a larger consolidation pattern, with a low and key support near the higher swing low of $3.02 from June.
Dynamic Support Strengthens Below Price
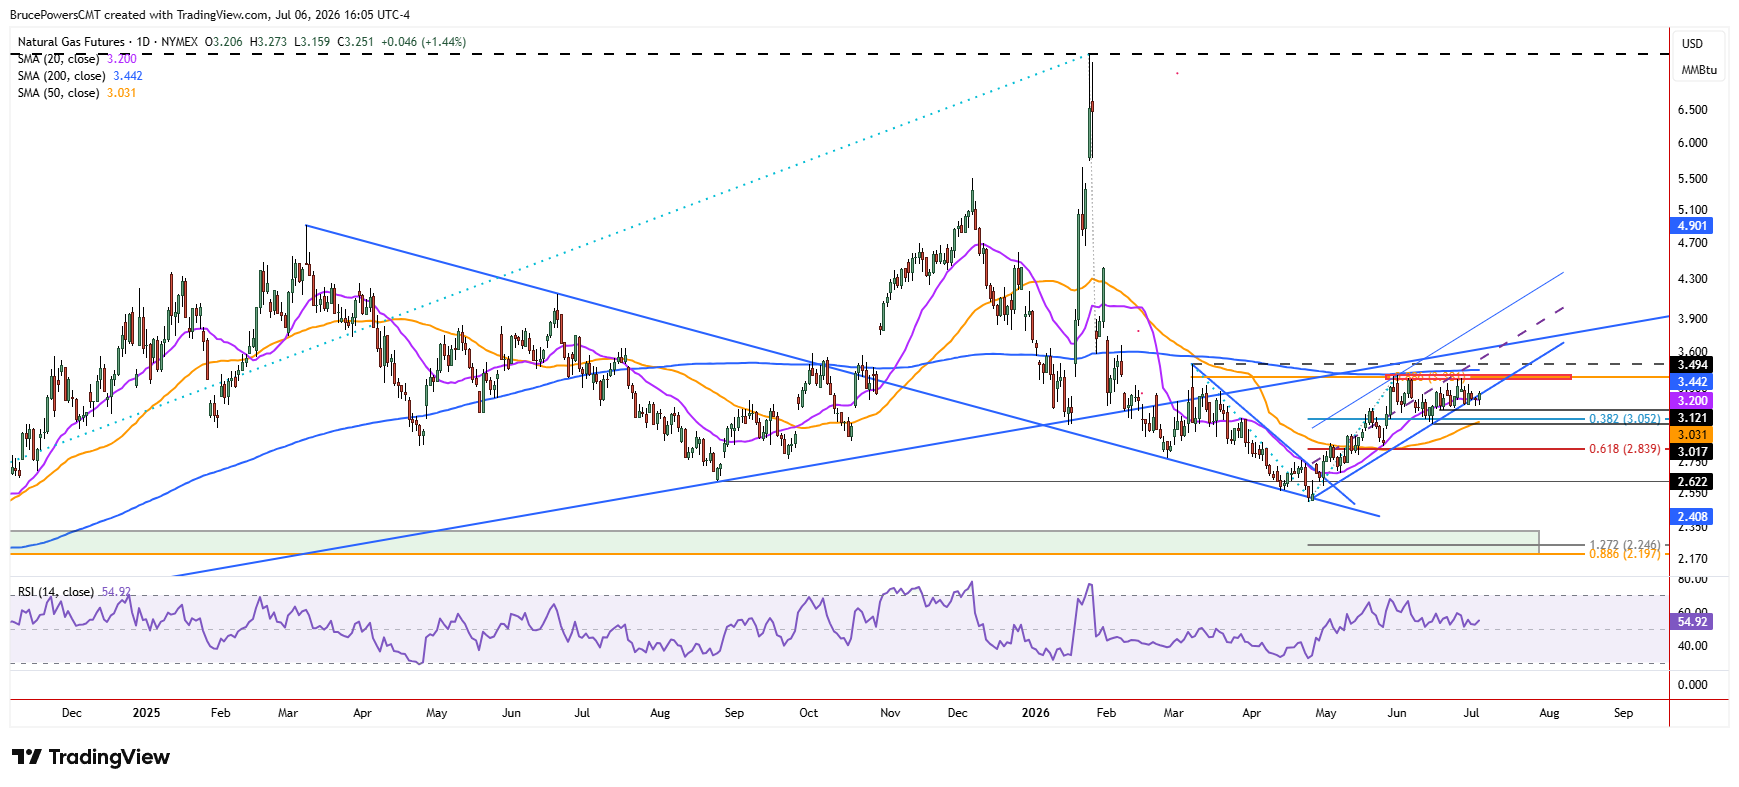
However, there is potentially significant dynamic support currently showing above that level near $3.03, as represented by the rising 50-day moving average. That average was reclaimed in mid-May and subsequently successfully tested as support during a pullback. Therefore, the 50-day moving average presents the more significant potential dynamic support zone. As it has risen recently above the high swing low of $3.02, it becomes more significant, since it shows support sitting just below the price structure at that swing low.
Breakout Scenario Still in Play
Given the failure to fall through support during recent tests, an upside continuation must also be considered. Strong potential resistance is marked near the 200-day moving average at $3.42, and if the prior trend high of $3.40 is exceeded, that indicator becomes the next upside target. However, if the 200-day moving average can be reclaimed, followed by a reversal signal above the lower swing high of $3.49 from March, there would be increased potential for the trend to continue higher.
If you’d like to know more about how to trade natural gas, please visit our educational area.