Testing a Critical Resistance Zone
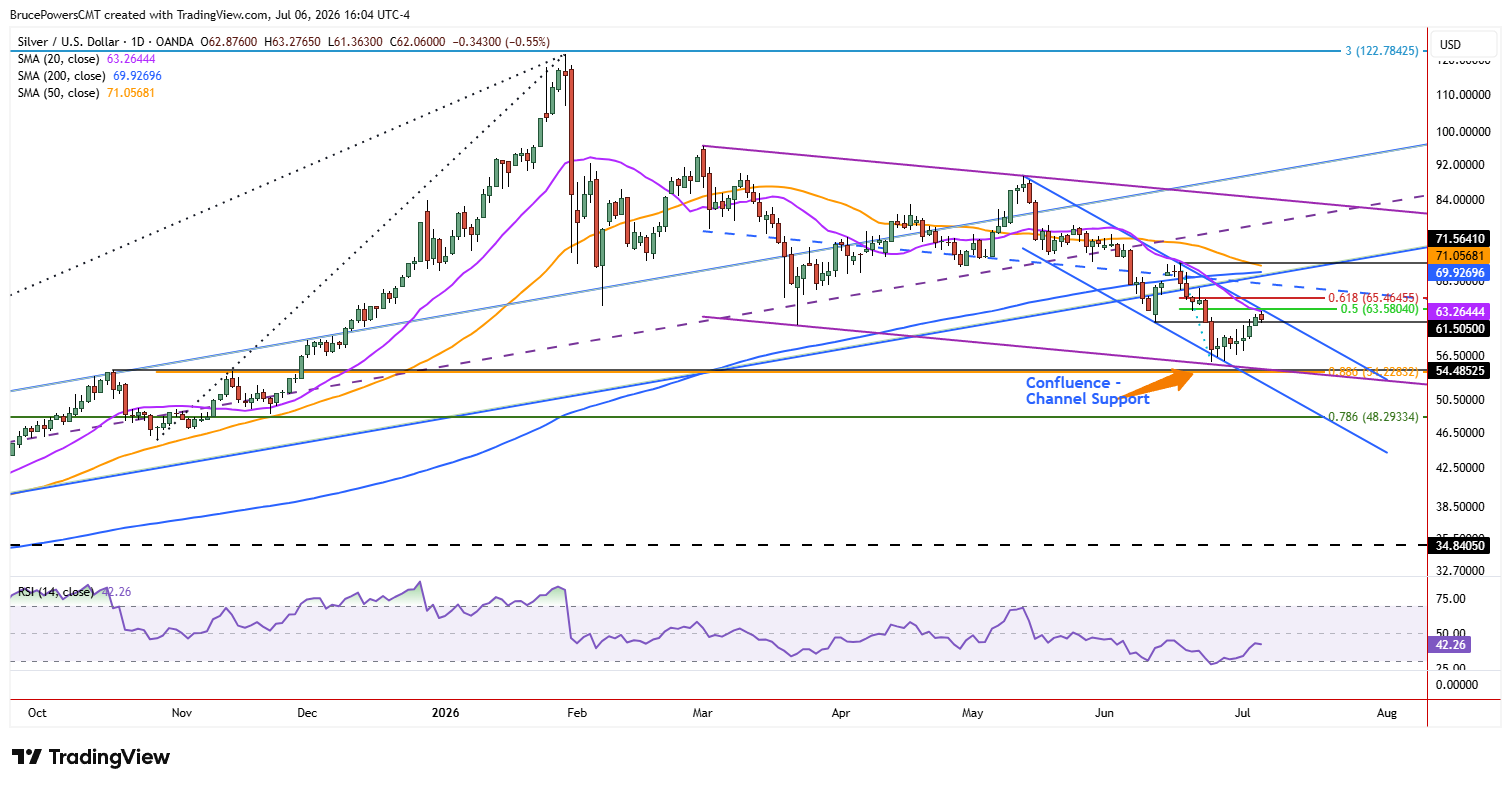
Silver extended its counter-trend rally on Monday into a key pivot zone, reaching a nine-day high of $63.28 as it tested trend resistance. Resistance emerged after that high, leading to an intraday pullback. A resistance zone is marked by the 20-day moving average near $63.26, aligned closely with the 50% retracement of the prior decline at $63.58, a downtrend line, and a prior weekly low at $63.29. Together, these indicators define a key resistance zone from approximately $63.26 to $63.58, marking the current test of that area particularly significant for silver’s next directional move.

Key Levels Signal Bullish or Bearish Outcome
The advance and subsequent intraday pullback leave silver in a position to possibly establish a lower swing high within the bearish correction. The 20-day moving average has defined dynamic resistance throughout the corrective decline since it was successfully tested as resistance in May, leading to further weakness. Similarly, in June, a bounce confirmed resistance near the 20-day average. A decline below Monday’s intraday low of $61.36 would signal a one-day reversal and further confirm resistance near the session’s high. That could lead to additional downside and another test of recent support near $55.60.
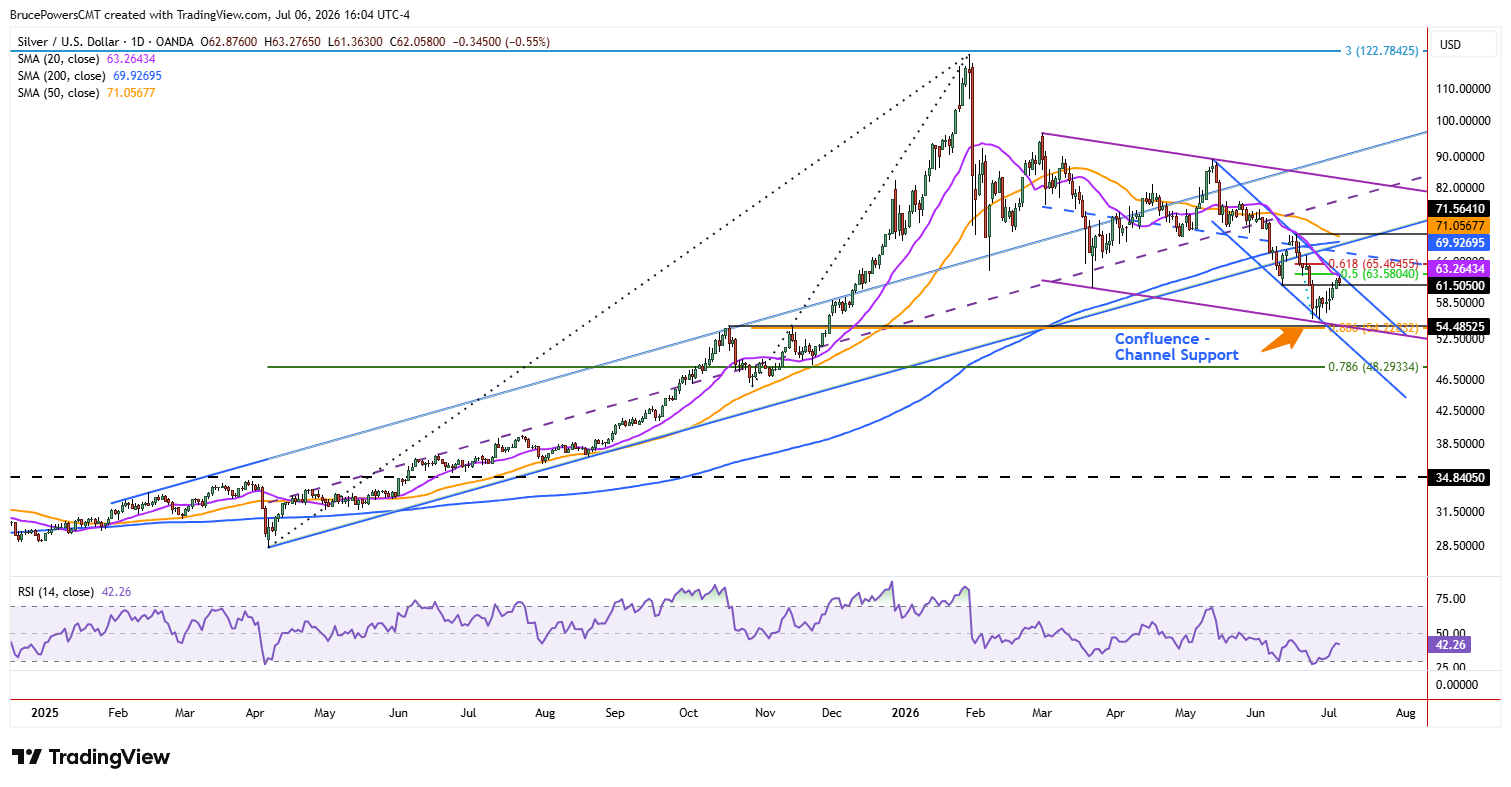
Alternatively, an upside breakout above $63.58 would be a bullish signal that could mark the beginning of a trend reversal following the bearish correction. If the recovery is sustained, silver could head toward the next upside target zone from around $69.93 to $71.56, consisting of the 200-day moving average and a lower swing high from June, respectively. Further validating the potential resistance zone are the 50-day moving average near $71.06 and a long-term uptrend line that previously represented dynamic support.
Momentum Improves as Resistance Takes Center Stage
There are a couple of other recent bullish signs to be aware of. First, Monday’s advance triggered a breakout above last week’s high of $62.90. Second, on Friday, silver closed above the prior trend low of $61.51 for the first time since falling below it, providing another indication that bullish momentum may be improving. Nevertheless, because silver is now testing the same key resistance zone highlighted at the beginning of this analysis, the next directional move will likely be determined by either a decisive breakout above the 50% retracement at $63.58 or a decline below Monday’s low.
If you’d like to know more about how to trade gold and silver, please visit our educational area.